
Page 211 - Soil and water contamination, 2nd edition
P. 211
198 Soil and Water Contamination
t=0 Centre of mass at times t , t , and t
x=0 1 2 3
t 1 t 2 t 3
L 1
L
2 x - direction
L 3
max
max
C at t 1 C at t 2 C at t 3
max
Concentration
6642 6642 6642
0 L L L 6642 6642
1 2 3
Distance (x)
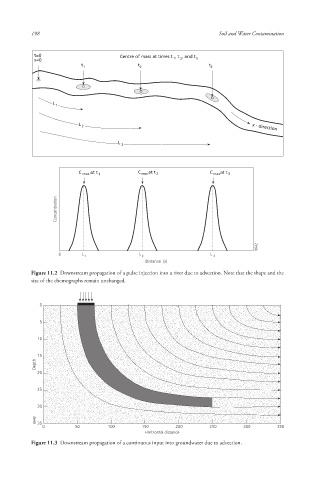
Figure 11.2 Downstream propagation of a pulse injection into a river due to advection. Note that the shape and the
size of the chemographs remain unchanged.
0
5
10
15
Depth
20
25
30
6642 6642 6642 35
0 50 100 150 200 250 300 350
Horizontal distance
Figure 11.3 Downstream propagation of a continuous input into groundwater due to advection.
10/1/2013 6:44:48 PM
Soil and Water.indd 210 10/1/2013 6:44:48 PM
Soil and Water.indd 210