Page 267 - Soil and water contamination, 2nd edition
P. 267

254                                                  Soil and Water Contamination

                    3.   In an 80 cm deep river, ammonium release from the bed sediment occurs at a rate of
                                                                    -1
                               -2
                                  -1
                       16 mg m  d .  The nitrification rate constant is 0.4 d  and the denitrification rate
                                    -1
                       constant is 0.8 d . If internal and external sources and sinks other than release from bed
                       sediments, nitrification, and denitrification can be ignored, and the above rate parameters
                       remain constant, the system tends to equilibrium.
                                                               -1
                       a.  Calculate the ammonium concentration in mg l  at equilibrium.
                                                          -1
                       b.  Calculate the nitrate concentration in mg l  at equilibrium.
                       c.   Name three sources or sinks apart from direct anthropogenic sources (e.g. effluent
                          discharges, agriculture) which may have been overlooked.
                    4.   In a laboratory experiment the following rate equation for the decomposition of o-xylene
                                           -1
                                         -1
                       was determined (in μg l  d ):
                       dS        45S

                       dt     1000 S

                       a. What does S mean
                          - in this particular equation?
                          - in general?
                       b.   In a graph plot the concentration against time (in days) given an initial  o-xylene
                                              -1
                          concentration of 1500 μg l ?
                                                                               -1
                       c.  How long does it take for the o-xylene concentration to fall to 70 μg l ?
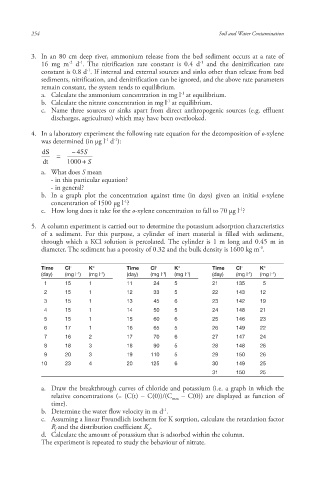
                    5.   A column experiment is carried out to determine the potassium adsorption characteristics
                       of a sediment. For this purpose, a cylinder of inert material is filled with sediment,
                       through which a KCl solution is percolated. The cylinder is 1 m long and 0.45 m in
                                                                                     -3
                       diameter. The sediment has a porosity of 0.32 and the bulk density  is 1600 kg m .

                       Time   Cl -  K +        Time   Cl -   K +       Time   Cl -   K +
                                                         -1
                                        -1
                                                                                        -1
                       (day)  (mg l )  (mg l )  (day)  (mg l )  (mg l )  (day)  (mg l )  (mg l )
                                                                -1
                                                                                  -1
                                 -1
                        1     15    1          11      24    5         21     135     5
                        2     15    1          12      33    5         22     143    12
                        3     15    1          13      45    6         23     142    19
                        4     15    1          14      50    5         24     148    21
                        5     15    1          15      60    6         25     146    23
                        6     17    1          16      65    5         26     149    22
                        7     16    2          17      70    6         27     147    24
                        8     18    3          18      90    5         28     148    26
                        9     20    3          19     110    5         29     150    26
                       10     23    4          20     125    6         30     149    25
                                                                       31     150    25

                       a.   Draw the breakthrough curves of chloride and potassium (i.e. a graph in which the
                          relative concentrations (= (C(t) – C(0))/(C  – C(0)) are displayed as function of
                                                            max
                          time).
                                                         -1
                       b.  Determine the water flow velocity in m d .
                       c.   Assuming a linear Freundlich isotherm for K sorption, calculate the retardation factor
                          R  and the distribution coefficient K .
                           f                         d
                       d.  Calculate the amount of potassium that is adsorbed within the column.
                       The experiment is repeated to study the behaviour of nitrate.


                                                                                            10/1/2013   6:45:15 PM
        Soil and Water.indd   266                                                           10/1/2013   6:45:15 PM
        Soil and Water.indd   266
   262   263   264   265   266   267   268   269   270   271   272