
Page 262 - Soil and water contamination, 2nd edition
P. 262
Chemical transformation 249
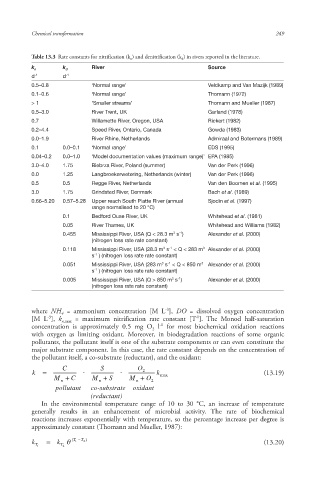
Table 13.3 Rate constants for nitrification (k n ) and denitrification (k d ) in rivers reported in the literature.
River Source
k n k d
d -1 d -1
0.5–0.8 ‘Normal range’ Veldkamp and Van Mazijk (1989)
0.1–0.6 ‘Normal range’ Thomann (1972)
> 1 ‘Smaller streams’ Thomann and Mueller (1987)
0.5–3.0 River Trent, UK Garland (1978)
0.7 Willamette River, Oregon, USA Rickert (1982)
0.2–4.4 Speed River, Ontario, Canada Gowda (1983)
0.0–1.9 River Rhine , Netherlands Admiraal and Botermans (1989)
0.1 0.0–0.1 ‘Normal range’ EDS (1995)
0.04–0.2 0.0–1.0 ‘Model documentation values (maximum range)’ EPA (1985)
3.0–4.0 1.75 Biebrza River, Poland (summer) Van der Perk (1996)
0.0 1.25 Langbroekerwetering, Netherlands (winter) Van der Perk (1996)
0.5 0.5 Regge River, Netherlands Van den Boomen et al. (1995)
3.0 1.75 Grindsted River, Denmark Bach et al. (1989)
0.66–5.20 0.57–5.28 Upper reach South Platte River (annual Sjodin et al. (1997)
range normalised to 20 °C)
0.1 Bedford Ouse River, UK Whitehead et al. (1981)
0.05 River Thames, UK Whitehead and Williams (1982)
-1
3
0.455 Mississippi River, USA (Q < 28.3 m s ) Alexander et al. (2000)
(nitrogen loss rate rate constant)
-1
0.118 Mississippi River, USA (28.3 m s < Q < 283 m Alexander et al. (2000)
3
3
s ) (nitrogen loss rate rate constant)
-1
-1
3
3
0.051 Mississippi River, USA (283 m s < Q < 850 m Alexander et al. (2000)
s ) (nitrogen loss rate rate constant)
-1
3
-1
0.005 Mississippi River, USA (Q > 850 m s ) Alexander et al. (2000)
(nitrogen loss rate rate constant)
-3
where NH = ammonium concentration [M L ], DO = dissolved oxygen concentration
4
-1
-3
[M L ], k = maximum nitrification rate constant [T ]. The Monod half-saturation
n,max
-1
concentration is approximately 0.5 mg O l for most biochemical oxidation reactions
2
with oxygen as limiting oxidant . Moreover, in biodegradation reactions of some organic
pollutants, the pollutant itself is one of the substrate components or can even constitute the
major substrate component. In this case, the rate constant depends on the concentration of
the pollutant itself, a co-substrate (reductant ), and the oxidant:
C S O 2
k k max (13.19)
M C M S M O 2
n
n
n
pollutant co-substrate oxidant oxidant
(reductant) (reductant )
In the environmental temperature range of 10 to 30 °C, an increase of temperature
generally results in an enhancement of microbial activity. The rate of biochemical
reactions increases exponentially with temperature, so the percentage increase per degree is
approximately constant (Thomann and Mueller, 1987):
k k ( 1 T 2 T ) (13.20)
1 T 2 T
10/1/2013 6:45:13 PM
Soil and Water.indd 261 10/1/2013 6:45:13 PM
Soil and Water.indd 261