
Page 261 - Soil and water contamination, 2nd edition
P. 261
248 Soil and Water Contamination
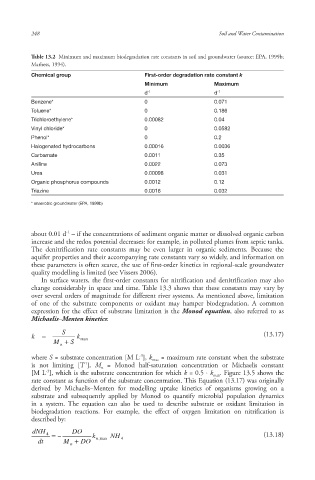
Table 13.2 Minimum and maximum biodegradation rate constants in soil and groundwater (source: EPA, 1999b;
Mathess, 1994).
Chemical group First-order degradation rate constant k
Minimum Maximum
d -1 d -1
Benzene* 0 0.071
Toluene* 0 0.186
Trichloroethylene* 0.00082 0.04
Vinyl chloride* 0 0.0582
Phenol* 0 0.2
Halogenated hydrocarbons 0.00016 0.0036
Carbamate 0.0011 0.35
Aniline 0.0022 0.073
Urea 0.00098 0.031
Organic phosphorus compounds 0.0012 0.12
Triazine 0.0018 0.032
* anaerobic groundwater (EPA, 1999b)
-1
about 0.01 d – if the concentrations of sediment organic matter or dissolved organic carbon
increase and the redox potential decreases: for example, in polluted plumes from septic tanks .
The denitrification rate constants may be even larger in organic sediments. Because the
aquifer properties and their accompanying rate constants vary so widely, and information on
these parameters is often scarce, the use of first-order kinetics in regional-scale groundwater
quality modelling is limited (see Vissers 2006).
In surface waters, the first-order constants for nitrification and denitrification may also
change considerably in space and time. Table 13.3 shows that these constants may vary by
over several orders of magnitude for different river systems. As mentioned above, limitation
of one of the substrate components or oxidant may hamper biodegradation . A common
expression for the effect of substrate limitation is the Monod equation , also referred to as
Michaelis–Menten kinetics :
S
k k max (13.17)
M S
n
-3
where S = substrate concentration [M L ], k = maximum rate constant when the substrate
max
-1
is not limiting [T ], M = Monod half-saturation concentration or Michaelis constant
n
-3
[M L ], which is the substrate concentration for which k = 0.5 ⋅ k . Figure 13.5 shows the
max
rate constant as function of the substrate concentration. This Equation (13.17) was originally
derived by Michaelis–Menten for modelling uptake kinetics of organisms growing on a
substrate and subsequently applied by Monod to quantify microbial population dynamics
in a system. The equation can also be used to describe substrate or oxidant limitation in
biodegradation reactions. For example, the effect of oxygen limitation on nitrification is
described by:
dNH DO
4
k , n max NH 4 (13.18)
dt M DO
n
10/1/2013 6:45:12 PM
Soil and Water.indd 260
Soil and Water.indd 260 10/1/2013 6:45:12 PM