
Page 226 - Solid Waste Analysis and Minimization a Systems Approach
P. 226
204 TRAINING AND IMPLEMENTATION
During the training session, example problems and trainee exercises may be ben-
eficial to allow the trainees to work together to solve waste minimization problems
in their work units and identify new waste reduction opportunities. A group discus-
sion can also be a useful component of the training exercise to gather feedback and
employee perceptions. The trainees should be made aware of the key metrics of the
waste reduction program. Specifically the environmental and economic impacts in
their work units should be presented and discussed. Many employees have a desire
to help the environment and by discussing the tons of solid waste that can be
reduced per year by applying the waste minimization programs and process changes,
the employees can gain a sense of contribution and motivation. By discussing the
financial benefits of waste minimization to the organization the employees can be
made aware that the programs will enhance job security by improving the bottom
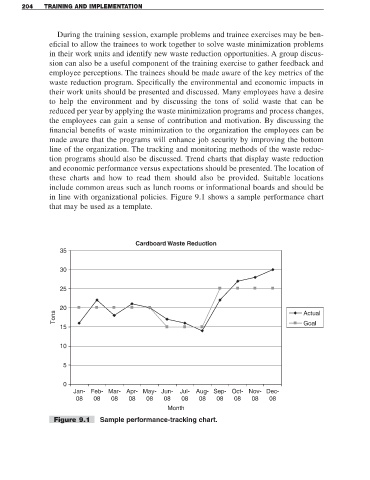
line of the organization. The tracking and monitoring methods of the waste reduc-
tion programs should also be discussed. Trend charts that display waste reduction
and economic performance versus expectations should be presented. The location of
these charts and how to read them should also be provided. Suitable locations
include common areas such as lunch rooms or informational boards and should be
in line with organizational policies. Figure 9.1 shows a sample performance chart
that may be used as a template.
Cardboard Waste Reduction
35
30
25
20
Tons Actual
15 Goal
10
5
0
Jan- Feb- Mar- Apr- May- Jun- Jul- Aug- Sep- Oct- Nov- Dec-
08 08 08 08 08 08 08 08 08 08 08 08
Month
Figure 9.1 Sample performance-tracking chart.