
Page 338 - Solid Waste Analysis and Minimization a Systems Approach
P. 338
316 MODEL SUMMARY AND RECOMMENDATIONS FOR FUTURE RESEARCH
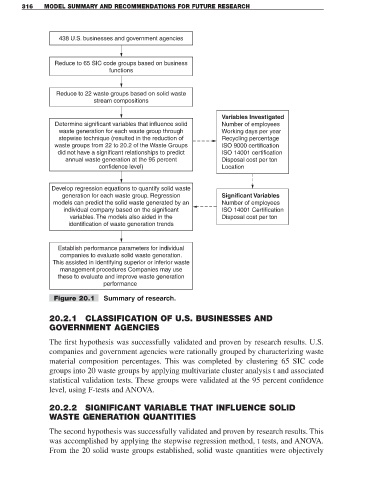
438 U.S. businesses and government agencies
Reduce to 65 SIC code groups based on business
functions
Reduce to 22 waste groups based on solid waste
stream compositions
Variables Investigated
Determine significant variables that influence solid Number of employees
waste generation for each waste group through Working days per year
stepwise technique (resulted in the reduction of Recycling percentage
waste groups from 22 to 20.2 of the Waste Groups ISO 9000 certification
did not have a significant relationships to predict ISO 14001 certification
annual waste generation at the 95 percent Disposal cost per ton
confidence level) Location
Develop regression equations to quantify solid waste
generation for each waste group. Regression Significant Variables
models can predict the solid waste generated by an Number of employees
individual company based on the significant ISO 14001 Certification
variables. The models also aided in the Disposal cost per ton
identification of waste generation trends
Establish performance parameters for individual
companies to evaluate solid waste generation.
This assisted in identifying superior or inferior waste
management procedures Companies may use
these to evaluate and improve waste generation
performance
Figure 20.1 Summary of research.
20.2.1 CLASSIFICATION OF U.S. BUSINESSES AND
GOVERNMENT AGENCIES
The first hypothesis was successfully validated and proven by research results. U.S.
companies and government agencies were rationally grouped by characterizing waste
material composition percentages. This was completed by clustering 65 SIC code
groups into 20 waste groups by applying multivariate cluster analysis t and associated
statistical validation tests. These groups were validated at the 95 percent confidence
level, using F-tests and ANOVA.
20.2.2 SIGNIFICANT VARIABLE THAT INFLUENCE SOLID
WASTE GENERATION QUANTITIES
The second hypothesis was successfully validated and proven by research results. This
was accomplished by applying the stepwise regression method, t tests, and ANOVA.
From the 20 solid waste groups established, solid waste quantities were objectively