
Page 335 - Solid Waste Analysis and Minimization a Systems Approach
P. 335
COST-BENEFIT ANALYSIS CASE STUDY 313
19.5 Cost-Benefit Analysis Case Study
A cost-benefit analysis was conducted on the out of control company as determined
from the performance parameters discussed in the previous section. This was to
demonstrate the potential cost savings and revenues that could be generated from
increased recycling. Such an analysis serves as an incentive to company management
to increase recycling. The analysis was conducted using the actual annual totals of non
recycled materials generated by the company. The national average landfill disposal
cost, as of April 2003, of $41 per ton was used for the calculations. National averages
for recycling commodities were used to calculate the potential revenues generated
from the sale of recyclables. These prices were gathered from Recycler’s World as of
April 2003 (www.recycle.net/price).
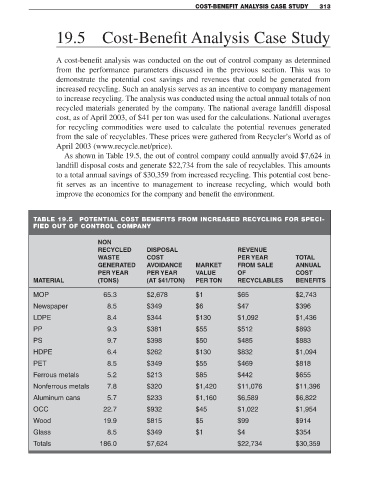
As shown in Table 19.5, the out of control company could annually avoid $7,624 in
landfill disposal costs and generate $22,734 from the sale of recyclables. This amounts
to a total annual savings of $30,359 from increased recycling. This potential cost bene-
fit serves as an incentive to management to increase recycling, which would both
improve the economics for the company and benefit the environment.
TABLE 19.5 POTENTIAL COST BENEFITS FROM INCREASED RECYCLING FOR SPECI-
FIED OUT OF CONTROL COMPANY
NON
RECYCLED DISPOSAL REVENUE
WASTE COST PER YEAR TOTAL
GENERATED AVOIDANCE MARKET FROM SALE ANNUAL
PER YEAR PER YEAR VALUE OF COST
MATERIAL (TONS) (AT $41/TON) PER TON RECYCLABLES BENEFITS
MOP 65.3 $2,678 $1 $65 $2,743
Newspaper 8.5 $349 $6 $47 $396
LDPE 8.4 $344 $130 $1,092 $1,436
PP 9.3 $381 $55 $512 $893
PS 9.7 $398 $50 $485 $883
HDPE 6.4 $262 $130 $832 $1,094
PET 8.5 $349 $55 $469 $818
Ferrous metals 5.2 $213 $85 $442 $655
Nonferrous metals 7.8 $320 $1,420 $11,076 $11,396
Aluminum cans 5.7 $233 $1,160 $6,589 $6,822
OCC 22.7 $932 $45 $1,022 $1,954
Wood 19.9 $815 $5 $99 $914
Glass 8.5 $349 $1 $4 $354
Totals 186.0 $7,624 $22,734 $30,359