
Page 333 - Solid Waste Analysis and Minimization a Systems Approach
P. 333
PERFORMANCE PARAMETER CASE STUDY 311
80
Individual company
Annual solid waste tons 40 Model predictions
actual data
60
20
0
MOP Newpaper LDPE PP PS HDPE PET Ferrous Non- Aluminum OCC Wood Food Glass Other
Material
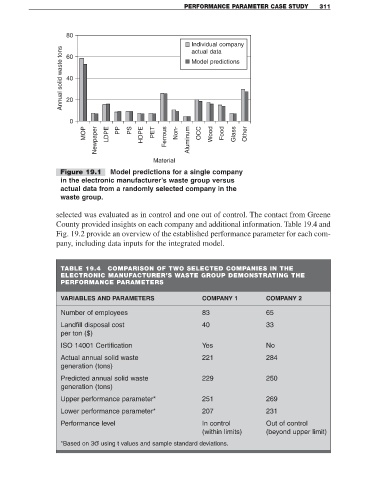
Figure 19.1 Model predictions for a single company
in the electronic manufacturer’s waste group versus
actual data from a randomly selected company in the
waste group.
selected was evaluated as in control and one out of control. The contact from Greene
County provided insights on each company and additional information. Table 19.4 and
Fig. 19.2 provide an overview of the established performance parameter for each com-
pany, including data inputs for the integrated model.
TABLE 19.4 COMPARISON OF TWO SELECTED COMPANIES IN THE
ELECTRONIC MANUFACTURER’S WASTE GROUP DEMONSTRATING THE
PERFORMANCE PARAMETERS
VARIABLES AND PARAMETERS COMPANY 1 COMPANY 2
Number of employees 83 65
Landfill disposal cost 40 33
per ton ($)
ISO 14001 Certification Yes No
Actual annual solid waste 221 284
generation (tons)
Predicted annual solid waste 229 250
generation (tons)
Upper performance parameter* 251 269
Lower performance parameter* 207 231
Performance level In control Out of control
(within limits) (beyond upper limit)
*Based on 3σ using t values and sample standard deviations.