
Page 334 - Solid Waste Analysis and Minimization a Systems Approach
P. 334
312 MODEL VALIDATION AND CASE STUDY APPLICATION
Performance Parameters—Company 1 (Within Parameters)
Lower Predicted value Upper
performance performance
parameter parameter
(3s C.L.) (3s C.L.)
Actual
generation
221 tons
Within
performance
level
207 tons 228 tons 251 tons
Performance Parameters – Company 2 (Beyond Parameters)
Lower Predicted value Upper
performance performance
parameter parameter
(3s C.L.) (3s C.L.)
Actual
generation
284 tons
Outside
performance
231 tons 250 tons 269 tons level
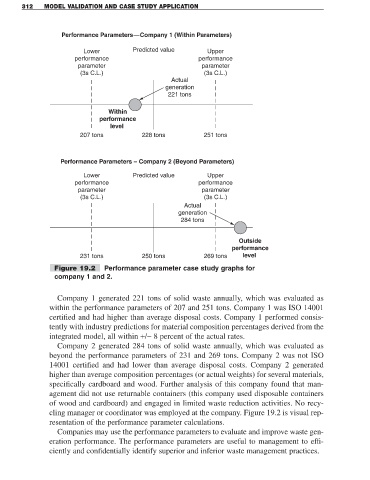
Figure 19.2 Performance parameter case study graphs for
company 1 and 2.
Company 1 generated 221 tons of solid waste annually, which was evaluated as
within the performance parameters of 207 and 251 tons. Company 1 was ISO 14001
certified and had higher than average disposal costs. Company 1 performed consis-
tently with industry predictions for material composition percentages derived from the
integrated model, all within +/− 8 percent of the actual rates.
Company 2 generated 284 tons of solid waste annually, which was evaluated as
beyond the performance parameters of 231 and 269 tons. Company 2 was not ISO
14001 certified and had lower than average disposal costs. Company 2 generated
higher than average composition percentages (or actual weights) for several materials,
specifically cardboard and wood. Further analysis of this company found that man-
agement did not use returnable containers (this company used disposable containers
of wood and cardboard) and engaged in limited waste reduction activities. No recy-
cling manager or coordinator was employed at the company. Figure 19.2 is visual rep-
resentation of the performance parameter calculations.
Companies may use the performance parameters to evaluate and improve waste gen-
eration performance. The performance parameters are useful to management to effi-
ciently and confidentially identify superior and inferior waste management practices.