
Page 329 - Solid Waste Analysis and Minimization a Systems Approach
P. 329
VALIDATION OF THE DEVELOPED ENVIRONMENTAL MODEL 307
collected is displayed in Table 19.1. The table displays the sources, location, and number
of waste records collected.
These data sources were identified from previous research conducted (Franchetti,
1999), professional waste management contacts, information gathered during the liter-
ature review, and Internet searches. Much raw data existed on waste generation levels
of individual companies, but little company information that quantified waste genera-
tion rates. Many state and local environmental agencies collected waste generation
data to use for various aggregate reports. These reports examined waste generation for
entire geographical regions, not individual companies. The individual data was stored
in files and rarely used for other purposes. This research consolidated some of this data
to validate the developed model.
The accuracy of this data is considered high because it was collected by the U.S.
government at the state and local levels. Different methodologies and survey tech-
niques were utilized to collect the existing data, and may contribute to variation.
19.2 Validation of the Developed
Environmental Model
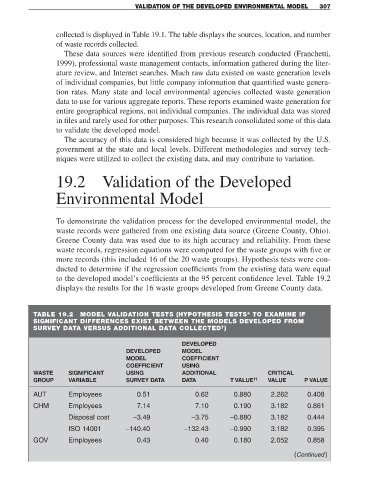
To demonstrate the validation process for the developed environmental model, the
waste records were gathered from one existing data source (Greene County, Ohio).
Greene County data was used due to its high accuracy and reliability. From these
waste records, regression equations were computed for the waste groups with five or
more records (this included 16 of the 20 waste groups). Hypothesis tests were con-
ducted to determine if the regression coefficients from the existing data were equal
to the developed model’s coefficients at the 95 percent confidence level. Table 19.2
displays the results for the 16 waste groups developed from Greene County data.
TABLE 19.2 MODEL VALIDATION TESTS (HYPOTHESIS TESTS* TO EXAMINE IF
SIGNIFICANT DIFFERENCES EXIST BETWEEN THE MODELS DEVELOPED FROM
†
SURVEY DATA VERSUS ADDITIONAL DATA COLLECTED )
DEVELOPED
DEVELOPED MODEL
MODEL COEFFICIENT
COEFFICIENT USING
WASTE SIGNIFICANT USING ADDITIONAL CRITICAL
GROUP VARIABLE SURVEY DATA DATA T VALUE †† VALUE P VALUE
AUT Employees 0.51 0.62 0.880 2.262 0.408
CHM Employees 7.14 7.10 0.190 3.182 0.861
Disposal cost −3.49 −3.75 −0.880 3.182 0.444
ISO 14001 −140.40 −132.43 −0.990 3.182 0.395
GOV Employees 0.43 0.40 0.180 2.052 0.858
(Continued)