
Page 422 - Solid Waste Analysis and Minimization a Systems Approach
P. 422
400 CHEMICAL AND PETROLEUM PROCESSING APPLICATIONS
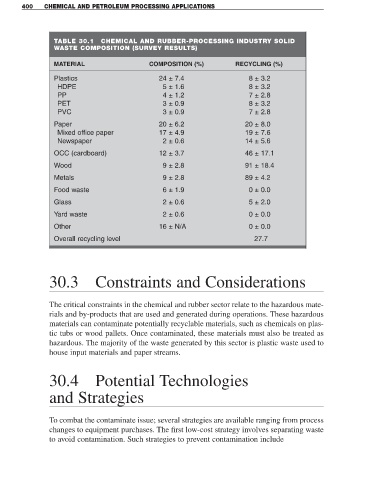
TABLE 30.1 CHEMICAL AND RUBBER-PROCESSING INDUSTRY SOLID
WASTE COMPOSITION (SURVEY RESULTS)
MATERIAL COMPOSITION (%) RECYCLING (%)
Plastics 24 ± 7.4 8 ± 3.2
HDPE 5 ± 1.6 8 ± 3.2
PP 4 ± 1.2 7 ± 2.8
PET 3 ± 0.9 8 ± 3.2
PVC 3 ± 0.9 7 ± 2.8
Paper 20 ± 6.2 20 ± 8.0
Mixed office paper 17 ± 4.9 19 ± 7.6
Newspaper 2 ± 0.6 14 ± 5.6
OCC (cardboard) 12 ± 3.7 46 ± 17.1
Wood 9 ± 2.8 91 ± 18.4
Metals 9 ± 2.8 89 ± 4.2
Food waste 6 ± 1.9 0 ± 0.0
Glass 2 ± 0.6 5 ± 2.0
Yard waste 2 ± 0.6 0 ± 0.0
Other 16 ± N/A 0 ± 0.0
Overall recycling level 27.7
30.3 Constraints and Considerations
The critical constraints in the chemical and rubber sector relate to the hazardous mate-
rials and by-products that are used and generated during operations. These hazardous
materials can contaminate potentially recyclable materials, such as chemicals on plas-
tic tubs or wood pallets. Once contaminated, these materials must also be treated as
hazardous. The majority of the waste generated by this sector is plastic waste used to
house input materials and paper streams.
30.4 Potential Technologies
and Strategies
To combat the contaminate issue; several strategies are available ranging from process
changes to equipment purchases. The first low-cost strategy involves separating waste
to avoid contamination. Such strategies to prevent contamination include