
Page 424 - Solid Waste Analysis and Minimization a Systems Approach
P. 424
402 CHEMICAL AND PETROLEUM PROCESSING APPLICATIONS
TABLE 30.2 ESTIMATED WEIGHT OF GENERATED SOLID WASTE STREAMS
RANK MATERIALS POUNDS/YEAR PERCENTAGE
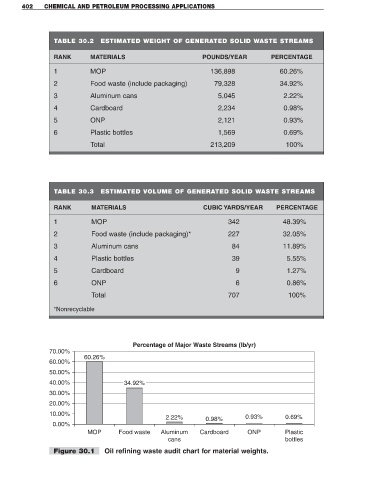
1 MOP 136,898 60.26%
2 Food waste (include packaging) 79,328 34.92%
3 Aluminum cans 5,045 2.22%
4 Cardboard 2,234 0.98%
5 ONP 2,121 0.93%
6 Plastic bottles 1,569 0.69%
Total 213,209 100%
TABLE 30.3 ESTIMATED VOLUME OF GENERATED SOLID WASTE STREAMS
RANK MATERIALS CUBIC YARDS/YEAR PERCENTAGE
1 MOP 342 48.39%
2 Food waste (include packaging)* 227 32.05%
3 Aluminum cans 84 11.89%
4 Plastic bottles 39 5.55%
5 Cardboard 9 1.27%
6 ONP 6 0.86%
Total 707 100%
*Nonrecyclable
Percentage of Major Waste Streams (Ib/yr)
70.00%
60.26%
60.00%
50.00%
40.00% 34.92%
30.00%
20.00%
10.00%
2.22% 0.98% 0.93% 0.69%
0.00%
MOP Food waste Aluminum Cardboard ONP Plastic
cans bottles
Figure 30.1 Oil refining waste audit chart for material weights.