Page 425 - Solid Waste Analysis and Minimization a Systems Approach
P. 425

CASE STUDY      403


                                             Percntage of Major Waste Streams (cubic yard/yr)
                    60.00%
                               48.39%
                    50.00%

                    40.00%
                                             32.05%
                    30.00%

                    20.00%
                                                          11.89%
                    10.00%
                                                                        5.55%
                                                                                      1.27%        0.86%
                     0.00%
                                 MOP          Food       Aluminum       Plastic     Cardboard       ONP
                                              waste         cans        bottles
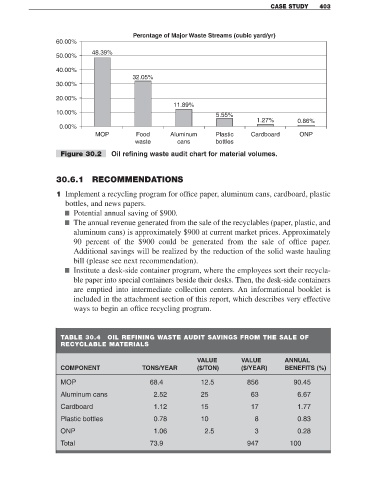
                     Figure 30.2      Oil refining waste audit chart for material volumes.


                    30.6.1 RECOMMENDATIONS

                    1 Implement a recycling program for office paper, aluminum cans, cardboard, plastic
                       bottles, and news papers.
                      ■ Potential annual saving of $900.
                      ■ The annual revenue generated from the sale of the recyclables (paper, plastic, and
                         aluminum cans) is approximately $900 at current market prices. Approximately
                         90 percent of the $900 could be generated from the sale of office paper.
                         Additional savings will be realized by the reduction of the solid waste hauling
                         bill (please see next recommendation).
                      ■ Institute a desk-side container program, where the employees sort their recycla-
                         ble paper into special containers beside their desks. Then, the desk-side containers
                         are emptied into intermediate collection centers. An informational booklet is
                         included in the attachment section of this report, which describes very effective
                         ways to begin an office recycling program.


                     TABLE 30.4      OIL REFINING WASTE AUDIT SAVINGS FROM THE SALE OF
                     RECYCLABLE MATERIALS


                                                                  VALUE          VALUE         ANNUAL
                     COMPONENT                  TONS/YEAR         ($/TON)        ($/YEAR)      BENEFITS (%)

                     MOP                           68.4            12.5            856            90.45

                     Aluminum cans                  2.52           25               63             6.67
                     Cardboard                      1.12           15               17             1.77

                     Plastic bottles                0.78           10                8             0.83
                     ONP                            1.06             2.5             3             0.28

                     Total                         73.9                            947           100
   420   421   422   423   424   425   426   427   428   429   430