
Page 440 - Solid Waste Analysis and Minimization a Systems Approach
P. 440
418 PRIMARY AND FABRICATED METAL INDUSTRIES
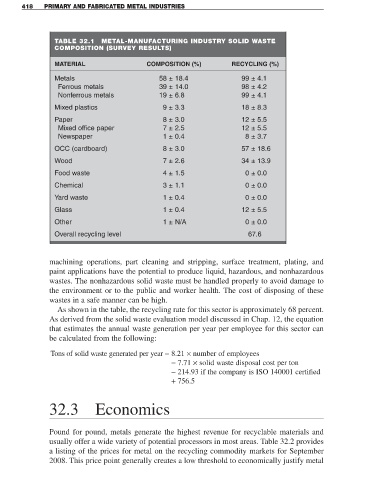
TABLE 32.1 METAL-MANUFACTURING INDUSTRY SOLID WASTE
COMPOSITION (SURVEY RESULTS)
MATERIAL COMPOSITION (%) RECYCLING (%)
Metals 58 ± 18.4 99 ± 4.1
Ferrous metals 39 ± 14.0 98 ± 4.2
Nonferrous metals 19 ± 6.8 99 ± 4.1
Mixed plastics 9 ± 3.3 18 ± 8.3
Paper 8 ± 3.0 12 ± 5.5
Mixed office paper 7 ± 2.5 12 ± 5.5
Newspaper 1 ± 0.4 8 ± 3.7
OCC (cardboard) 8 ± 3.0 57 ± 18.6
Wood 7 ± 2.6 34 ± 13.9
Food waste 4 ± 1.5 0 ± 0.0
Chemical 3 ± 1.1 0 ± 0.0
Yard waste 1 ± 0.4 0 ± 0.0
Glass 1 ± 0.4 12 ± 5.5
Other 1 ± N/A 0 ± 0.0
Overall recycling level 67.6
machining operations, part cleaning and stripping, surface treatment, plating, and
paint applications have the potential to produce liquid, hazardous, and nonhazardous
wastes. The nonhazardous solid waste must be handled properly to avoid damage to
the environment or to the public and worker health. The cost of disposing of these
wastes in a safe manner can be high.
As shown in the table, the recycling rate for this sector is approximately 68 percent.
As derived from the solid waste evaluation model discussed in Chap. 12, the equation
that estimates the annual waste generation per year per employee for this sector can
be calculated from the following:
Tons of solid waste generated per year = 8.21 × number of employees
− 7.71 × solid waste disposal cost per ton
− 214.93 if the company is ISO 140001 certified
+ 756.5
32.3 Economics
Pound for pound, metals generate the highest revenue for recyclable materials and
usually offer a wide variety of potential processors in most areas. Table 32.2 provides
a listing of the prices for metal on the recycling commodity markets for September
2008. This price point generally creates a low threshold to economically justify metal