
Page 459 - Solid Waste Analysis and Minimization a Systems Approach
P. 459
ECONOMICS 437
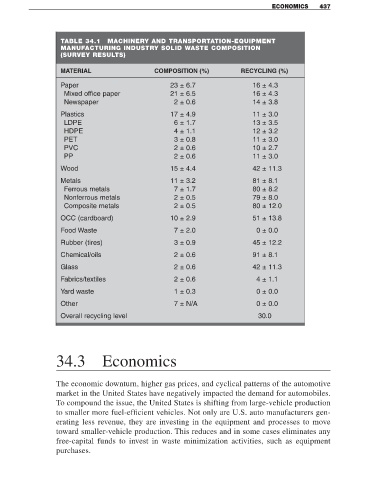
TABLE 34.1 MACHINERY AND TRANSPORTATION-EQUIPMENT
MANUFACTURING INDUSTRY SOLID WASTE COMPOSITION
(SURVEY RESULTS)
MATERIAL COMPOSITION (%) RECYCLING (%)
Paper 23 ± 6.7 16 ± 4.3
Mixed office paper 21 ± 6.5 16 ± 4.3
Newspaper 2 ± 0.6 14 ± 3.8
Plastics 17 ± 4.9 11 ± 3.0
LDPE 6 ± 1.7 13 ± 3.5
HDPE 4 ± 1.1 12 ± 3.2
PET 3 ± 0.8 11 ± 3.0
PVC 2 ± 0.6 10 ± 2.7
PP 2 ± 0.6 11 ± 3.0
Wood 15 ± 4.4 42 ± 11.3
Metals 11 ± 3.2 81 ± 8.1
Ferrous metals 7 ± 1.7 80 ± 8.2
Nonferrous metals 2 ± 0.5 79 ± 8.0
Composite metals 2 ± 0.5 80 ± 12.0
OCC (cardboard) 10 ± 2.9 51 ± 13.8
Food Waste 7 ± 2.0 0 ± 0.0
Rubber (tires) 3 ± 0.9 45 ± 12.2
Chemical/oils 2 ± 0.6 91 ± 8.1
Glass 2 ± 0.6 42 ± 11.3
Fabrics/textiles 2 ± 0.6 4 ± 1.1
Yard waste 1 ± 0.3 0 ± 0.0
Other 7 ± N/A 0 ± 0.0
Overall recycling level 30.0
34.3 Economics
The economic downturn, higher gas prices, and cyclical patterns of the automotive
market in the United States have negatively impacted the demand for automobiles.
To compound the issue, the United States is shifting from large-vehicle production
to smaller more fuel-efficient vehicles. Not only are U.S. auto manufacturers gen-
erating less revenue, they are investing in the equipment and processes to move
toward smaller-vehicle production. This reduces and in some cases eliminates any
free-capital funds to invest in waste minimization activities, such as equipment
purchases.