
Page 463 - Solid Waste Analysis and Minimization a Systems Approach
P. 463
CASE STUDY 441
recycled materials. The plant recycled over 107 million pounds of solid waste each
year. Of the total, metal-stamping scrap comprises over 90 percent.
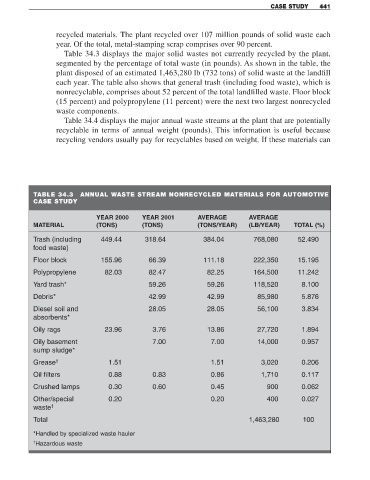
Table 34.3 displays the major solid wastes not currently recycled by the plant,
segmented by the percentage of total waste (in pounds). As shown in the table, the
plant disposed of an estimated 1,463,280 lb (732 tons) of solid waste at the landfill
each year. The table also shows that general trash (including food waste), which is
nonrecyclable, comprises about 52 percent of the total landfilled waste. Floor block
(15 percent) and polypropylene (11 percent) were the next two largest nonrecycled
waste components.
Table 34.4 displays the major annual waste streams at the plant that are potentially
recyclable in terms of annual weight (pounds). This information is useful because
recycling vendors usually pay for recyclables based on weight. If these materials can
TABLE 34.3 ANNUAL WASTE STREAM NONRECYCLED MATERIALS FOR AUTOMOTIVE
CASE STUDY
YEAR 2000 YEAR 2001 AVERAGE AVERAGE
MATERIAL (TONS) (TONS) (TONS/YEAR) (LB/YEAR) TOTAL (%)
Trash (including 449.44 318.64 384.04 768,080 52.490
food waste)
Floor block 155.96 66.39 111.18 222,350 15.195
Polypropylene 82.03 82.47 82.25 164,500 11.242
Yard trash* 59.26 59.26 118,520 8.100
Debris* 42.99 42.99 85,980 5.876
Diesel soil and 28.05 28.05 56,100 3.834
absorbents*
Oily rags 23.96 3.76 13.86 27,720 1.894
Oily basement 7.00 7.00 14,000 0.957
sump sludge*
Grease † 1.51 1.51 3,020 0.206
Oil filters 0.88 0.83 0.86 1,710 0.117
Crushed lamps 0.30 0.60 0.45 900 0.062
Other/special 0.20 0.20 400 0.027
waste †
Total 1,463,280 100
*Handled by specialized waste hauler
† Hazardous waste