
Page 468 - Solid Waste Analysis and Minimization a Systems Approach
P. 468
446 TRANSPORTATION, LOGISTICAL, AND WAREHOUSING APPLICATIONS
valued at $13 trillion was carried within the United States. When analyzing the U.S.
logistics market, however, one must examine inefficiencies in logistics services result-
ing from deficiencies in U.S. infrastructure that could create broad economic disrup-
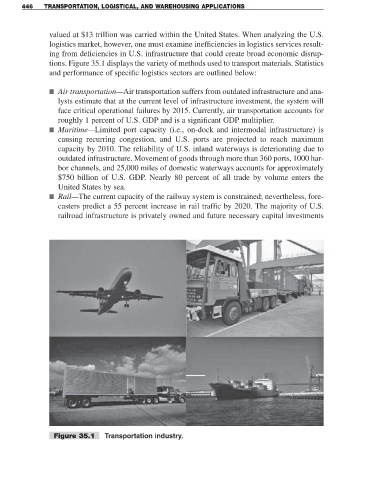
tions. Figure 35.1 displays the variety of methods used to transport materials. Statistics
and performance of specific logistics sectors are outlined below:
■ Air transportation—Air transportation suffers from outdated infrastructure and ana-
lysts estimate that at the current level of infrastructure investment, the system will
face critical operational failures by 2015. Currently, air transportation accounts for
roughly 1 percent of U.S. GDP and is a significant GDP multiplier.
■ Maritime—Limited port capacity (i.e., on-dock and intermodal infrastructure) is
causing recurring congestion, and U.S. ports are projected to reach maximum
capacity by 2010. The reliability of U.S. inland waterways is deteriorating due to
outdated infrastructure. Movement of goods through more than 360 ports, 1000 har-
bor channels, and 25,000 miles of domestic waterways accounts for approximately
$750 billion of U.S. GDP. Nearly 80 percent of all trade by volume enters the
United States by sea.
■ Rail—The current capacity of the railway system is constrained; nevertheless, fore-
casters predict a 55 percent increase in rail traffic by 2020. The majority of U.S.
railroad infrastructure is privately owned and future necessary capital investments
Figure 35.1 Transportation industry.