
Page 470 - Solid Waste Analysis and Minimization a Systems Approach
P. 470
448 TRANSPORTATION, LOGISTICAL, AND WAREHOUSING APPLICATIONS
35.2 Waste Management Goals
and Opportunities
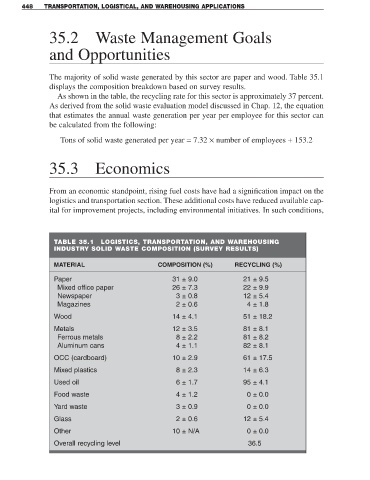
The majority of solid waste generated by this sector are paper and wood. Table 35.1
displays the composition breakdown based on survey results.
As shown in the table, the recycling rate for this sector is approximately 37 percent.
As derived from the solid waste evaluation model discussed in Chap. 12, the equation
that estimates the annual waste generation per year per employee for this sector can
be calculated from the following:
Tons of solid waste generated per year = 7.32 × number of employees + 153.2
35.3 Economics
From an economic standpoint, rising fuel costs have had a signification impact on the
logistics and transportation section. These additional costs have reduced available cap-
ital for improvement projects, including environmental initiatives. In such conditions,
TABLE 35.1 LOGISTICS, TRANSPORTATION, AND WAREHOUSING
INDUSTRY SOLID WASTE COMPOSITION (SURVEY RESULTS)
MATERIAL COMPOSITION (%) RECYCLING (%)
Paper 31 ± 9.0 21 ± 9.5
Mixed office paper 26 ± 7.3 22 ± 9.9
Newspaper 3 ± 0.8 12 ± 5.4
Magazines 2 ± 0.6 4 ± 1.8
Wood 14 ± 4.1 51 ± 18.2
Metals 12 ± 3.5 81 ± 8.1
Ferrous metals 8 ± 2.2 81 ± 8.2
Aluminum cans 4 ± 1.1 82 ± 8.1
OCC (cardboard) 10 ± 2.9 61 ± 17.5
Mixed plastics 8 ± 2.3 14 ± 6.3
Used oil 6 ± 1.7 95 ± 4.1
Food waste 4 ± 1.2 0 ± 0.0
Yard waste 3 ± 0.9 0 ± 0.0
Glass 2 ± 0.6 12 ± 5.4
Other 10 ± N/A 0 ± 0.0
Overall recycling level 36.5