
Page 64 - Solid Waste Analysis and Minimization a Systems Approach
P. 64
42 BACKGROUND AND FUNDAMENTALS OF SOLID WASTE ANALYSIS AND MINIMIZATION
Total U.S. MSW generation rates (1960 to 2006)
300
251.3
238.3
250
214.3
205.2
200
Tons (millions) 150 151.6
100 121.1
88.1
50
0
1960 1970 1980 1990 1995 2000 2006
Year
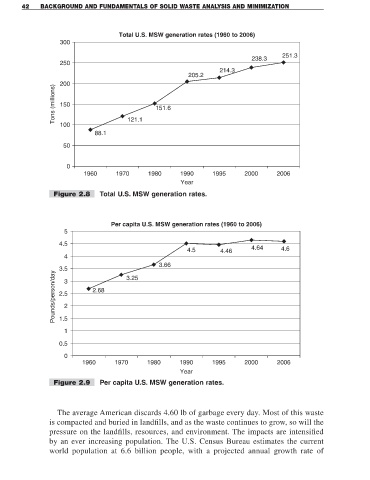
Figure 2.8 Total U.S. MSW generation rates.
Per capita U.S. MSW generation rates (1960 to 2006)
5
4.5
4.5 4.46 4.64 4.6
4
3.66
3.5 3.25
Pounds/person/day 2.5 2.68
3
2
1.5
1
0.5
0
1960 1970 1980 1990 1995 2000 2006
Year
Figure 2.9 Per capita U.S. MSW generation rates.
The average American discards 4.60 lb of garbage every day. Most of this waste
is compacted and buried in landfills, and as the waste continues to grow, so will the
pressure on the landfills, resources, and environment. The impacts are intensified
by an ever increasing population. The U.S. Census Bureau estimates the current
world population at 6.6 billion people, with a projected annual growth rate of