
Page 60 - Solid Waste Analysis and Minimization a Systems Approach
P. 60
38 BACKGROUND AND FUNDAMENTALS OF SOLID WASTE ANALYSIS AND MINIMIZATION
U.S. MSW recycling rates
35.0%
30.0%
29.1%
Recycling percentage 20.0% 16.2%
25.0%
15.0%
10.0%
6.4% 6.6% 9.6%
5.0%
0.0%
1960 1970 1980 1990 2000
Year
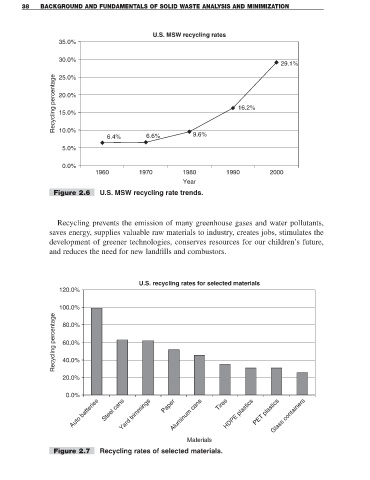
Figure 2.6 U.S. MSW recycling rate trends.
Recycling prevents the emission of many greenhouse gases and water pollutants,
saves energy, supplies valuable raw materials to industry, creates jobs, stimulates the
development of greener technologies, conserves resources for our children’s future,
and reduces the need for new landfills and combustors.
U.S. recycling rates for selected materials
120.0%
100.0%
Recycling percentage 80.0%
60.0%
40.0%
20.0%
0.0%
Glass containers
Auto batteries Steel cans Yard trimmings Paper Aluminum cans Tires HDPE plastics PET plastics
Materials
Figure 2.7 Recycling rates of selected materials.