Page 58 - Solid Waste Analysis and Minimization a Systems Approach
P. 58

36    BACKGROUND AND FUNDAMENTALS OF SOLID WASTE ANALYSIS AND MINIMIZATION


                                         Trends in total MSW generation (1960 to 2000)
                     300


                     250


                     200
                   Tons (millions)  150


                     100


                      50


                       0
                               1960           1970           1980           1990           2000
                                                             Year
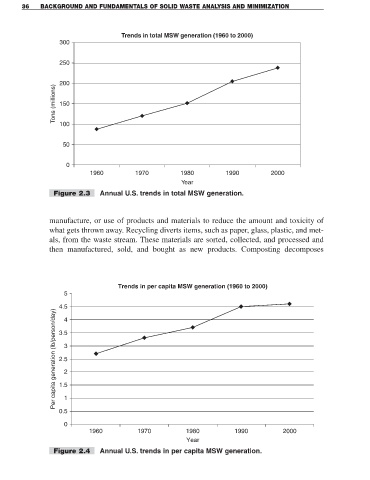
                   Figure 2.3     Annual U.S. trends in total MSW generation.


                 manufacture, or use of products and materials to reduce the amount and toxicity of
                 what gets thrown away. Recycling diverts items, such as paper, glass, plastic, and met-
                 als, from the waste stream. These materials are sorted, collected, and processed and
                 then manufactured, sold, and bought as new products. Composting decomposes


                                        Trends in per capita MSW generation (1960 to 2000)
                      5

                     4.5
                   Per capita generation (lb/person/day)  3.5
                      4


                      3

                     2.5
                      2

                     1.5

                      1
                     0.5

                      0
                              1960             1970            1980            1990            2000
                                                               Year
                   Figure 2.4     Annual U.S. trends in per capita MSW generation.
   53   54   55   56   57   58   59   60   61   62   63