
Page 59 - Solid Waste Analysis and Minimization a Systems Approach
P. 59
SOLID WASTE GENERATION AROUND THE WORLD 37
U.S. MSW recycling rates
80.0
70.0
60.0
Tons (millions) 50.0
40.0
30.0
20.0
10.0
0.0
1960 1970 1980 1990 2000
Year
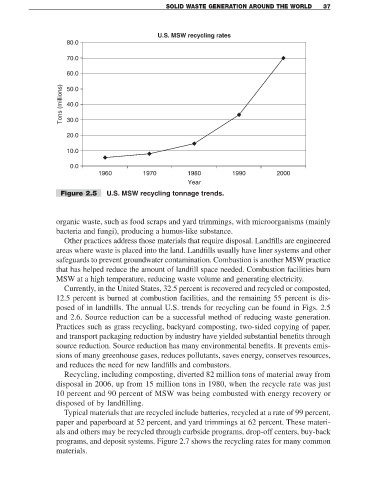
Figure 2.5 U.S. MSW recycling tonnage trends.
organic waste, such as food scraps and yard trimmings, with microorganisms (mainly
bacteria and fungi), producing a humus-like substance.
Other practices address those materials that require disposal. Landfills are engineered
areas where waste is placed into the land. Landfills usually have liner systems and other
safeguards to prevent groundwater contamination. Combustion is another MSW practice
that has helped reduce the amount of landfill space needed. Combustion facilities burn
MSW at a high temperature, reducing waste volume and generating electricity.
Currently, in the United States, 32.5 percent is recovered and recycled or composted,
12.5 percent is burned at combustion facilities, and the remaining 55 percent is dis-
posed of in landfills. The annual U.S. trends for recycling can be found in Figs. 2.5
and 2.6. Source reduction can be a successful method of reducing waste generation.
Practices such as grass recycling, backyard composting, two-sided copying of paper,
and transport packaging reduction by industry have yielded substantial benefits through
source reduction. Source reduction has many environmental benefits. It prevents emis-
sions of many greenhouse gases, reduces pollutants, saves energy, conserves resources,
and reduces the need for new landfills and combustors.
Recycling, including composting, diverted 82 million tons of material away from
disposal in 2006, up from 15 million tons in 1980, when the recycle rate was just
10 percent and 90 percent of MSW was being combusted with energy recovery or
disposed of by landfilling.
Typical materials that are recycled include batteries, recycled at a rate of 99 percent,
paper and paperboard at 52 percent, and yard trimmings at 62 percent. These materi-
als and others may be recycled through curbside programs, drop-off centers, buy-back
programs, and deposit systems. Figure 2.7 shows the recycling rates for many common
materials.