
Page 57 - Solid Waste Analysis and Minimization a Systems Approach
P. 57
SOLID WASTE GENERATION AROUND THE WORLD 35
applying limited statistical analyses (usually only the mean are calculated) and rarely
calculating variances. These current methods significantly increase the variability and
inaccuracy of the estimates.
This type of research had not been conducted earlier for several reasons. First, most
solid waste studies are conducted by the government, which is concerned with aggre-
gate data, not individual company data. Federal, state, and local level governments
collect data from individual companies and use it for overall waste generation and
recycling statistics. This provides an overview of the total generation, but offers few
insights on specific waste generation quantities and recycling levels on the individual
companies or groups that comprise the total.
Another reason why this type of research has not been conducted earlier is because
the appropriate data had not been consolidated or analyzed. A portion of the data
required for this research existed, but was never processed into useful information.
The data could have been collected, but the effort was never taken until this research.
Contributing to data collection issues, some companies view solid waste data as con-
fidential and are hesitant to release it to the government. Finally, most solid waste gen-
eration studies involved minimal statistical modeling.
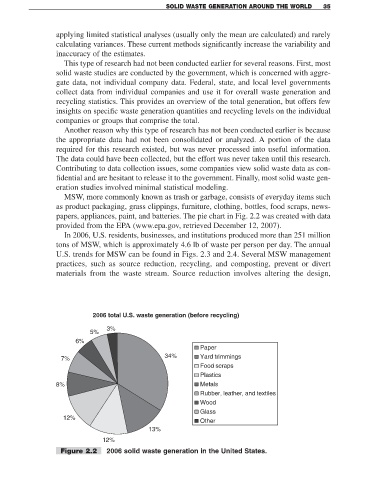
MSW, more commonly known as trash or garbage, consists of everyday items such
as product packaging, grass clippings, furniture, clothing, bottles, food scraps, news-
papers, appliances, paint, and batteries. The pie chart in Fig. 2.2 was created with data
provided from the EPA (www.epa.gov, retrieved December 12, 2007).
In 2006, U.S. residents, businesses, and institutions produced more than 251 million
tons of MSW, which is approximately 4.6 lb of waste per person per day. The annual
U.S. trends for MSW can be found in Figs. 2.3 and 2.4. Several MSW management
practices, such as source reduction, recycling, and composting, prevent or divert
materials from the waste stream. Source reduction involves altering the design,
2006 total U.S. waste generation (before recycling)
3%
5%
6%
Paper
34% Yard trimmings
7%
Food scraps
Plastics
8% Metals
Rubber, leather, and textiles
Wood
Glass
12%
Other
13%
12%
Figure 2.2 2006 solid waste generation in the United States.