
Page 56 - Solid Waste Analysis and Minimization a Systems Approach
P. 56
34 BACKGROUND AND FUNDAMENTALS OF SOLID WASTE ANALYSIS AND MINIMIZATION
to understand, control, and reduce solid waste generation. This section compiles data
from various sources to create a comprehensive picture and provides a discussion on
commonly used solid waste metrics.
2.4.2 WASTE GENERATION RATES IN THE UNITED STATES
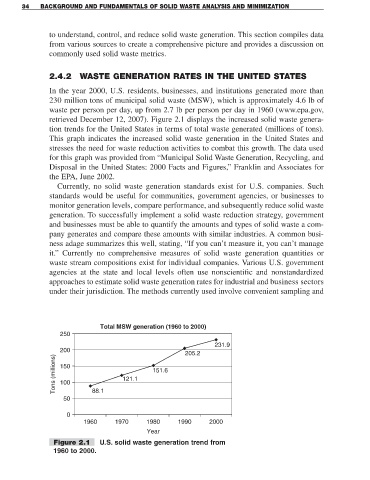
In the year 2000, U.S. residents, businesses, and institutions generated more than
230 million tons of municipal solid waste (MSW), which is approximately 4.6 lb of
waste per person per day, up from 2.7 lb per person per day in 1960 (www.epa.gov,
retrieved December 12, 2007). Figure 2.1 displays the increased solid waste genera-
tion trends for the United States in terms of total waste generated (millions of tons).
This graph indicates the increased solid waste generation in the United States and
stresses the need for waste reduction activities to combat this growth. The data used
for this graph was provided from “Municipal Solid Waste Generation, Recycling, and
Disposal in the United States: 2000 Facts and Figures,” Franklin and Associates for
the EPA, June 2002.
Currently, no solid waste generation standards exist for U.S. companies. Such
standards would be useful for communities, government agencies, or businesses to
monitor generation levels, compare performance, and subsequently reduce solid waste
generation. To successfully implement a solid waste reduction strategy, government
and businesses must be able to quantify the amounts and types of solid waste a com-
pany generates and compare these amounts with similar industries. A common busi-
ness adage summarizes this well, stating, “If you can’t measure it, you can’t manage
it.” Currently no comprehensive measures of solid waste generation quantities or
waste stream compositions exist for individual companies. Various U.S. government
agencies at the state and local levels often use nonscientific and nonstandardized
approaches to estimate solid waste generation rates for industrial and business sectors
under their jurisdiction. The methods currently used involve convenient sampling and
Total MSW generation (1960 to 2000)
250
231.9
200 205.2
Tons (millions) 150 121.1 151.6
100
50 88.1
0
1960 1970 1980 1990 2000
Year
Figure 2.1 U.S. solid waste generation trend from
1960 to 2000.