
Page 106 - Standard Handbook Of Petroleum & Natural Gas Engineering
P. 106
Applied Statistics 95
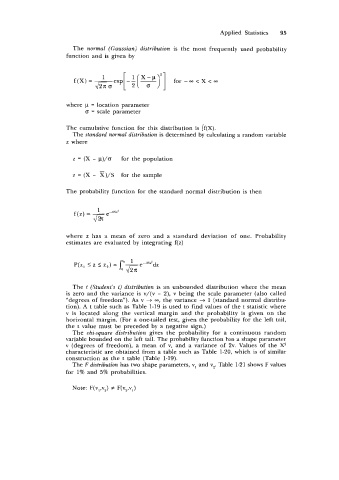
The normal (Gaussian) distribution is the most frequently used probability
function and is given by
where y = location parameter
o = scale parameter
The cumulative function for this distribution is ff(X).
The standard normal distribution is determined by calculating a random variable
z where
z = (X - y)/o for the population
z = (X - x)/S for the sample
The probability function for the standard normal distribution is then
where z has a mean of zero and a standard deviation of one. Probability
estimates are evaluated by integrating f(z)
The t (Student’s t) distribution is an unbounded distribution where the mean
is zero and the variance is v/(v - 2), v being the scale parameter (also called
“degrees of freedom”). As v -+ 00, the variance + 1 (standard normal distribu-
tion). A t table such as Table 1-19 is used to find values of the t statistic where
v is located along the vertical margin and the probability is given on the
horizontal margin. (For a one-tailed test, given the probability for the left tail,
the t value must be preceded by a negative sign.)
The chi-square distribution gives the probability for a continuous random
variable bounded on the left tail. The probability function has a shape parameter
v (degrees of freedom), a mean of v, and a variance of 2v. Values of the X2
characteristic are obtained from a table such as Table 1-20, which is of similar
construction as the t table (Table 1-19).
The F distribution has two shape parameters, v, and v2. Table 1-21 shows F values
for 1% and 5% probabilities.
Note: F(v,,v,) f F(v,,v,)