
Page 332 - Standard Handbook Petroleum Natural Gas Engineering VOLUME2
P. 332
Fluid Movement in Waterflooded Reservoirs 499
W
I
I-
x
40-
W
a
T3
2
W
304000
CUMULATIVE WmR INJECTED FROM 8-17-81, bbl
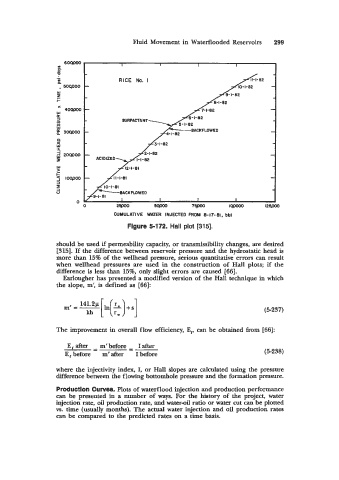
Figure 5-172. Hall plot [315].
should be used if permeability capacity, or transmissibility changes, are desired
[315]. If the difference between reservoir pressure and the hydrostatic head is
more than 15% of the wellhead pressure, serious quantitative errors can result
when wellhead pressures are used in the construction of Hall plots; if the
difference is less than 15%, only slight errors are caused [66].
Earlougher has presented a modified version of the Hall technique in which
the slope, m', is defined as [66]:
(5-237)
The improvement in overall flow efficiency, E,, can be obtained from [66]:
E,after -m'before =- Iafter
-
E,before m'after Ibefore (5-238)
where the injectivity index, I, or Hall slopes are calculated using the pressure
difference between the flowing bottomhole pressure and the formation pressure.
Production Curves. Plots of waterflood injection and production performance
can be presented in a number of ways. For the history of the project, water
injection rate, oil production rate, and water4 ratio or water cut can be plotted
vs. time (usually months). The actual water injection and oil production rates
can be compared to the predicted rates on a time basis.