
Page 333 - Standard Handbook Petroleum Natural Gas Engineering VOLUME2
P. 333
300 Reservoir Engineering
Future oil production and ultimate recovery are often extrapolated from
graphical methods. One of the more popular methods is a plot of the WOR
on a log scale vs. cumulative oil production on a linear scale or a linear plot of
the fractional water cut (or percent water produced) vs. cumulative oil produced.
Alternatively, the oil-water ratio can be plotted on a log scale vs. the cumulative
production on a linear scale. One of the purposes of these plots is to predict
the ultimate oil recovery by extrapolating the curve to some economic limit at
which time it becomes no longer profitable to continue the flood. If the
operating methods remain relatively unchanged, a method [317] has been
proposed for a fully developed waterflood that permits an easy extrapolation
of recovery to a given water cut. This latter method consists of a linear plot of
ql fractional recovery of oil in place, vs. the term - {[(l/fJ - I] - (l/fJ}.
This method also provides an estimate of water-oil relative permeabiliries.
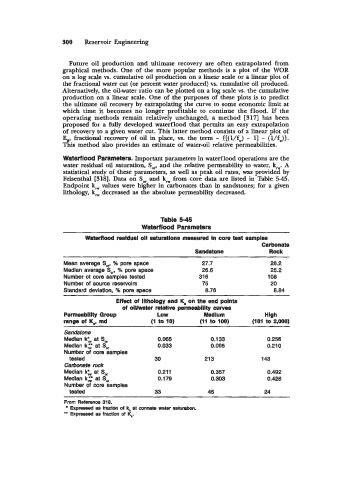
Waterflood Parameters. Important parameters in waterflood operations are the
water residual oil saturation, Sm, and the relative permeability to -water, k,. A
statistical study of these parameters, as well as peak oil rates, was provided by
Felsenthal [SlS]. Data on Sm and k, from core data are listed in Table 545.
Endpoint krw values were higher in carbonates than in sandstones; for a given
lithology, k, decreased as the absolute permeability decreased.
Table 5-45
Watetflood Parameters
Waterflood residual oll saturations measured in core test samples
Carbonate
Sandstone Rock
Mean average S,, % pore space 27.7 26.2
Median average So,, % pore space 26.6 25.2
Number ot core samples tested 316 108
Number of source reservoirs 75 20
Standard deviation, % pore space 8.76 8.84
Effect of lithology and K, on the end points
of oluwater relative permeabllity curves
Permeablllty Group Low Medium High
range of 6, md (1 to IO) (I1 to loo) (101 to 2,000)
Sandstone
Median kk at S, 0.065 0.133 0.256
Median kc at S, 0.033 0.095 0.210
Number of core samples
tested 30 21 3 143
Carbonate rock
Median k*, at So, 0.211 0.357 0.492
Median k; at S, 0.179 0.503 0.428
Number of core samples
tested 33 4s 24
From Reference 318.
Expressed as fracton of at connate water aaturabon.
** Expressed as fractlon of q.