
Page 413 - Standard Handbook Petroleum Natural Gas Engineering VOLUME2
P. 413
Properties of Hydrocarbon Mixtures 379
saturation curve (Figure 6-3). A schematic representation of differential vaporiza-
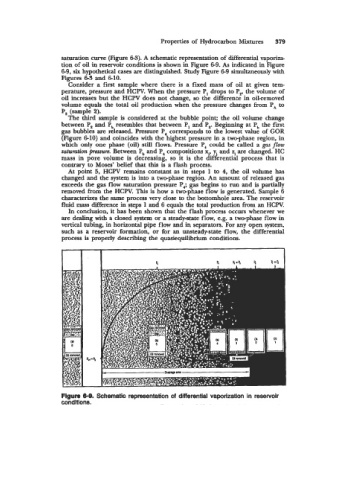
tion of oil in reservoir conditions is shown in Figure 6-9. As indicated in Figure
6-9, six hypothetical cases are distinguished. Study Figure 6-9 simultaneously with
Figures 6-3 and 6-10.
Consider a first sample where there is a fixed mass of oil at given tem-
perature, pressure and HCW. When the pressure P, drops to p,, the volume of
oil increases but the HCPV does not change, so the difference in oil-removed
volume equals the total oil production when the pressure changes from PA to
P, (sample 2).
The third sample is considered at the bubble point; the oil volume change
between P, and Pb resembles that between P, and P,. Beginning at P, the first
gas bubbles are released. Pressure P4 corresponds to the lowest value of GOR
(Figure 6-10) and coincides with the highest pressure in a two-phase region, in
which only one phase (oil) still flows. Pressure P, could be called a gas flow
saturation fmsmm. Between P, and P, compositions xi, yi and zi are changed. HC
mass in pore volume is decreasing, so it is the differential process that is
contrary to Moses' belief that this is a flash process.
At point 5, HCPV remains constant as in steps 1 to 4, the oil volume has
changed and the system is into a two-phase region. An amount of released gas
exceeds the gas flow saturation pressure F4; gas begins to run and is partially
removed from the HCPV. This is haw a two-phase flow is generated. Sample 6
characterizes the same process very close to the bottomhole area. The reservoir
fluid mass &rence in steps 1 and 6 equals the total production from an HCW.
In conclusion, it has been shown that the flash process occurs whenever we
are dealing with a closed system or a steady-state flow, e.g. a two-phase flow in
vertical tubing, in horizontal pipe flow and in separators. For any open system,
such as a reservoir formation, m for an unsteady-state flow, the differential
process is properly describing the quasiequilibrium conditions.
P*=
Figure 6-8. Schematic representation of differential vaporization in reservoir
conditions.