
Page 411 - Standard Handbook Petroleum Natural Gas Engineering VOLUME2
P. 411
Properties of Hydrocarbon Mixtures 377
pressure-volume slope is indicated. The above procedure indicates that flash
vaporization is a phase-changing process due to change pressure and tem-
perature if the mass of reservoir fluid or total composition system remains
constant and can be expressed as follows:
zF = XL + yV (6-15)
where z = mole fraction of component in a reservoir fluid mixture
F = number of moles of sample at initial reservoir pressure and temperature
x = mole fraction of component in liquid (e.g., P5)
L = number of moles of equilibrium liquid
y = mole fraction component in gas mixture
V = number of moles of equilibrium gas phase
Equilibrium or flash liberation calculations .may be made for reservoir fluid
that divides into two phases at any temperature and pressure.
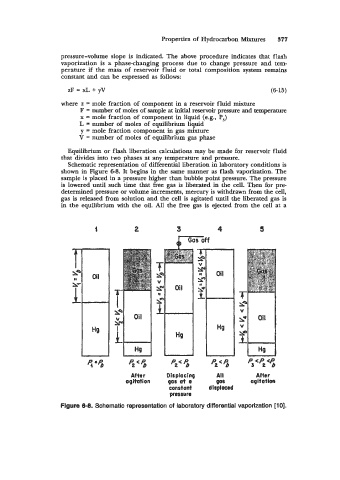
Schematic representation of differential liberation in laboratory conditions is
shown in Figure 6-8. It begins in the same manner as flash vaporization. The
sample is placed in a pressure higher than bubble point pressure. The pressure
is lowered until such time that free gas is liberated in the cell. Then for pre
determined pressure or volume increments, mercury is withdrawn from the cell,
gas is released from solution and the cell is agitated until the liberated gas is
in the equilibrium with the oil. All the free gas is ejected from the cell at a
After Dirplocinq I All After
opitation gas at a 90s agitation
constant displaced
pressure
Figure 6-8. Schematic representation of laboratory differential vaporization [lo].