
Page 130 - Statistics II for Dummies
P. 130
114
Part II: Using Different Types of Regression to Make Predictions
Among the best one-variable, two-variable, three-variable, four-variable,
and five-variable models, which one should you choose for your final mul-
tiple regression model? Which model is the best of the best? With all these
results, it would be easy to have a major freakout over which one to pick,
2
but never fear — Mallow’s is here (along with his friendly sidekick, the R
adjusted).
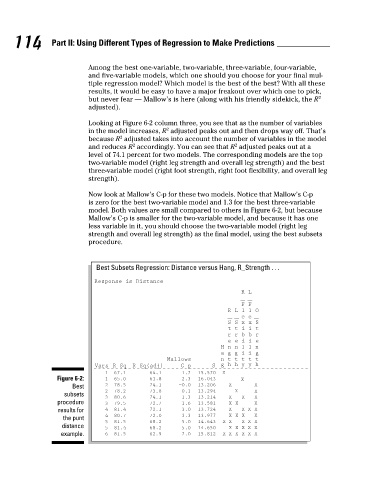
Looking at Figure 6-2 column three, you see that as the number of variables
2
in the model increases, R adjusted peaks out and then drops way off. That’s
2
because R adjusted takes into account the number of variables in the model
2
2
and reduces R accordingly. You can see that R adjusted peaks out at a
level of 74.1 percent for two models. The corresponding models are the top
two-variable model (right leg strength and overall leg strength) and the best
three-variable model (right foot strength, right foot flexibility, and overall leg
strength).
Now look at Mallow’s C-p for these two models. Notice that Mallow’s C-p
is zero for the best two-variable model and 1.3 for the best three-variable
model. Both values are small compared to others in Figure 6-2, but because
Mallow’s C-p is smaller for the two-variable model, and because it has one
less variable in it, you should choose the two-variable model (right leg
strength and overall leg strength) as the final model, using the best subsets
procedure.
Best Subsets Regression: Distance versus Hang, R_Strength . . .
Response is Distance
R L
F F
R L 1 1 O
e e
S S x x S
t t i i t
r r b b r
e e i i e
H n n 1 1 n
a g g i i g
Mallows n t t t t t
Vars R-Sq R-Sq(adj) C-p S g h h y y h
1 67.1 64.1 1.7 15.570 X
Figure 6-2: 1 65.0 61.8 2.3 16.043 X
Best 2 78.5 74.1 −0.0 13.206 X X
2 78.2 73.8 0.1 13.294 X X
subsets
3 80.6 74.1 1.3 13.214 X X X
procedure 3 79.5 72.7 1.6 13.581 X X X
results for 4 81.4 72.1 3.0 13.724 X X X X
the punt 4 80.7 72.0 3.3 13.977 X X X X
5 81.5 68.2 5.0 14.643 X X X X X
distance 5 81.4 68.2 5.0 14.650 X X X X X
example. 6 81.5 62.9 7.0 15.812 X X X X X X
7/23/09 9:27:04 PM
11_466469-ch06.indd 114
11_466469-ch06.indd 114 7/23/09 9:27:04 PM