
Page 133 - Statistics II for Dummies
P. 133
Chapter 7: Getting Ahead of the Learning Curve with Nonlinear Regression 117
This example illustrates the basics of nonlinear regression; the rest of the
chapter shows you how the model breaks down.
9
8 7
Time to Do Task (Minutes) 6 5
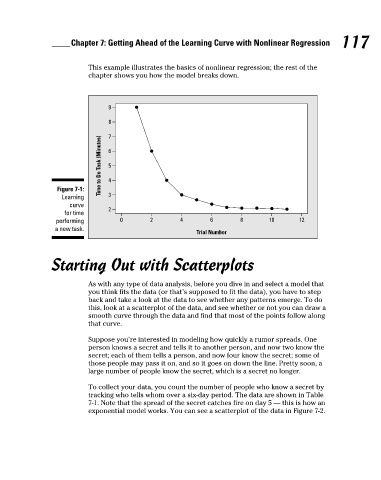
Figure 7-1: 4
Learning 3
curve 2
for time
performing 0 2 4 6 8 10 12
a new task. Trial Number
Starting Out with Scatterplots
As with any type of data analysis, before you dive in and select a model that
you think fits the data (or that’s supposed to fit the data), you have to step
back and take a look at the data to see whether any patterns emerge. To do
this, look at a scatterplot of the data, and see whether or not you can draw a
smooth curve through the data and find that most of the points follow along
that curve.
Suppose you’re interested in modeling how quickly a rumor spreads. One
person knows a secret and tells it to another person, and now two know the
secret; each of them tells a person, and now four know the secret; some of
those people may pass it on, and so it goes on down the line. Pretty soon, a
large number of people know the secret, which is a secret no longer.
To collect your data, you count the number of people who know a secret by
tracking who tells whom over a six-day period. The data are shown in Table
7-1. Note that the spread of the secret catches fire on day 5 — this is how an
exponential model works. You can see a scatterplot of the data in Figure 7-2.
12_466469-ch07.indd 117 7/24/09 9:39:07 AM