
Page 151 - Statistics II for Dummies
P. 151
Chapter 7: Getting Ahead of the Learning Curve with Nonlinear Regression 135
normal distribution. Note that the histogram in the lower-left corner
doesn’t look all that bell-shaped, but you don’t have a lot of data in this
example, and the rest of the residual plots seem okay. So, you have little
cause to really worry.
Table 7-2 Log(y) Values for the Secret-Spreading Data
x (Day) y (Number of People) log(y)
1 1 0.00
2 2 0.30
3 5 0.70
4 7 0.85
5 17 1.23
6 30 1.48
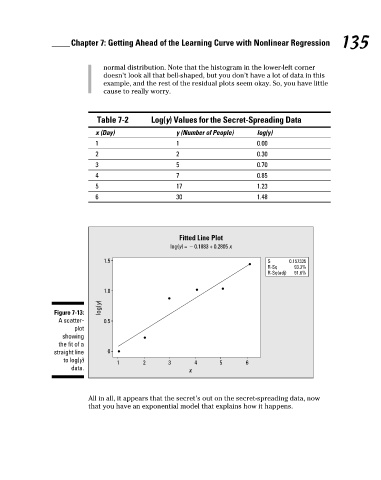
Fitted Line Plot
log(y) = − 0.1883 + 0.2805 x
1.5 S 0.157335
R-Sq 93.3%
R-Sq(adj) 91.6%
1.0
log(y)
Figure 7-13:
A scatter- 0.5
plot
showing
the fit of a
straight line 0
to log(y) 1 2 3 4 5 6
data.
x
All in all, it appears that the secret’s out on the secret-spreading data, now
that you have an exponential model that explains how it happens.
12_466469-ch07.indd 135 7/24/09 9:39:11 AM