
Page 149 - Statistics II for Dummies
P. 149
Chapter 7: Getting Ahead of the Learning Curve with Nonlinear Regression 133
5. Assess the fit of the model by looking at the scatterplot of the log(y)
2
data, checking out the value of R (adjusted) for the straight-line
model for log(y), and checking the residual plots for the log(y) data.
The techniques and criteria you use to do this are the same as those I dis-
cuss in the previous section “Assessing the fit of a polynomial model.”
If these steps seem dubious to you, stick with me. The example in the next
section lets you see each step firsthand, which helps a great deal. In the end,
actually finding predictions by using an exponential model is a lot easier to
do than it is to explain.
Spreading secrets at an exponential rate
Often, the best way to figure something out is to see it in action. Using the
secret-spreading example from Figure 7-2, you can work through the series
of steps from the preceding section to find the best-fitting exponential model
and use it to make predictions.
Step one: Check the scatterplot
Your goal in step one is to make a scatterplot of the secret-spreading data
and determine whether the data resemble the curved function of an expo-
nential model. Figure 7-2 shows the data for the spread of a number of people
knowing the secret, as a function of the number of days. You can see that the
number of people who know the secret starts out small, but then as more
and more people tell more and more people, the number grows quickly until
the secret isn’t a secret anymore. This is a good situation for an exponential
model, due to the amount of upward curvature in this graph.
Step two: Let Minitab do its thing to log(y)
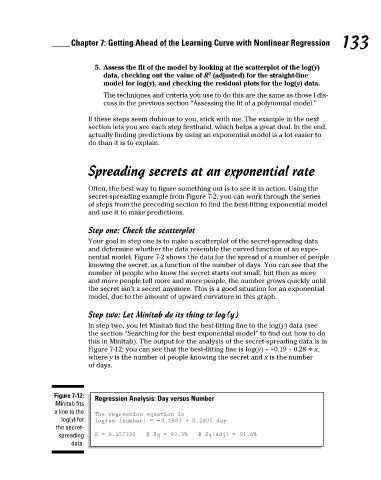
In step two, you let Minitab find the best-fitting line to the log(y) data (see
the section “Searching for the best exponential model” to find out how to do
this in Minitab). The output for the analysis of the secret-spreading data is in
Figure 7-12; you can see that the best-fitting line is log(y) = –0.19 + 0.28 * x,
where y is the number of people knowing the secret and x is the number
of days.
Figure 7-12: Regression Analysis: Day versus Number
Minitab fits
a line to the The regression equation is
log(y) for logten (number) = − 0.1883 + 0.2805 day
the secret-
spreading S = 0.157335 R-Sq = 93.3% R-Sq(adj) = 91.6%
data.
12_466469-ch07.indd 133 7/24/09 9:39:11 AM