
Page 144 - Statistics II for Dummies
P. 144
128 Part II: Using Different Types of Regression to Make Predictions
A residual is the amount of error, or leftover, that occurs when you fit a
model to a data set. The residuals are the distances between the predicted
values in the model and the observed values of the data themselves. For each
observed y-value in the data set, you also have a predicted value from the
model, typically called y-hat, denoted ˆy. The residual is the difference between
the values of y and y-hat. Each y-value in the data set has a residual; you exam-
ine all the residuals together as a group, looking for patterns or unusually high
values (indicating a big difference between the observed y and the predicted
y at that point; see Chapter 4 for the full info on residuals and their plots).
In order for the model to fit well, the residuals need to meet two conditions:
✓ The residuals are independent. The independence of residuals means
that you don’t see any pattern as you plot the residuals. The residuals
don’t affect each other and should be random.
✓ The residuals have a normal distribution centered at zero, and the
standardized residuals follow suit. Having a normal distribution with
mean zero means that most of the residuals should be centered around
zero, with fewer of them occurring the farther from zero you get. You
should observe about as many residuals above the zero line as below it.
If the residuals are standardized, this means that as a group their stan-
dard deviation is 1; you should expect about 95 percent of them to lie
between –2 and +2, following the 68-95-99.7 Rule (see your Stats I text).
You determine whether or not these two conditions are met for the residu-
als by using a series of four graphs called residual plots. Most statisticians
prefer to standardize the residuals (meaning they convert them to Z-scores
by subtracting their mean and dividing by their standard deviation) before
looking at them, because then they can compare the residuals with values on
a Z-distribution. If you take this step also, you can ask Minitab to give you a
series of four standardized residual plots with which to check the conditions.
(See Chapter 4 for full details on standardized residuals and residual plots.)
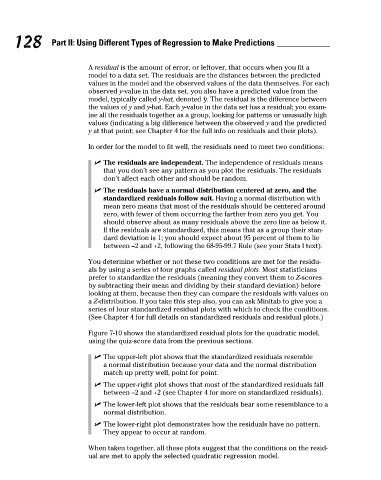
Figure 7-10 shows the standardized residual plots for the quadratic model,
using the quiz-score data from the previous sections.
✓ The upper-left plot shows that the standardized residuals resemble
a normal distribution because your data and the normal distribution
match up pretty well, point for point.
✓ The upper-right plot shows that most of the standardized residuals fall
between –2 and +2 (see Chapter 4 for more on standardized residuals).
✓ The lower-left plot shows that the residuals bear some resemblance to a
normal distribution.
✓ The lower-right plot demonstrates how the residuals have no pattern.
They appear to occur at random.
When taken together, all these plots suggest that the conditions on the resid-
ual are met to apply the selected quadratic regression model.
12_466469-ch07.indd 128 7/24/09 9:39:10 AM