
Page 142 - Statistics II for Dummies
P. 142
126 Part II: Using Different Types of Regression to Make Predictions
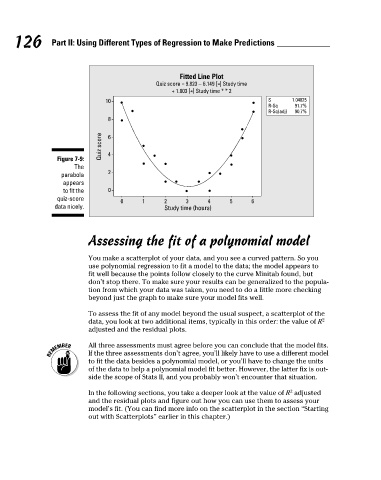
Fitted Line Plot
Quiz score = 9.823 − 6.149 [ ] Study time
*
+ 1.003 [ ] Study time * * 2
*
10 S 1.04825
R-Sq 91.7%
R-Sq(adj) 90.7%
8
Quiz score 6
Figure 7-9: 4
The
parabola 2
appears
to fit the 0
quiz-score 0 1 2 3 4 5 6
data nicely. Study time (hours)
Assessing the fit of a polynomial model
You make a scatterplot of your data, and you see a curved pattern. So you
use polynomial regression to fit a model to the data; the model appears to
fit well because the points follow closely to the curve Minitab found, but
don’t stop there. To make sure your results can be generalized to the popula-
tion from which your data was taken, you need to do a little more checking
beyond just the graph to make sure your model fits well.
To assess the fit of any model beyond the usual suspect, a scatterplot of the
2
data, you look at two additional items, typically in this order: the value of R
adjusted and the residual plots.
All three assessments must agree before you can conclude that the model fits.
If the three assessments don’t agree, you’ll likely have to use a different model
to fit the data besides a polynomial model, or you’ll have to change the units
of the data to help a polynomial model fit better. However, the latter fix is out-
side the scope of Stats II, and you probably won’t encounter that situation.
2
In the following sections, you take a deeper look at the value of R adjusted
and the residual plots and figure out how you can use them to assess your
model’s fit. (You can find more info on the scatterplot in the section “Starting
out with Scatterplots” earlier in this chapter.)
12_466469-ch07.indd 126 7/24/09 9:39:09 AM