
Page 140 - Statistics II for Dummies
P. 140
124 Part II: Using Different Types of Regression to Make Predictions
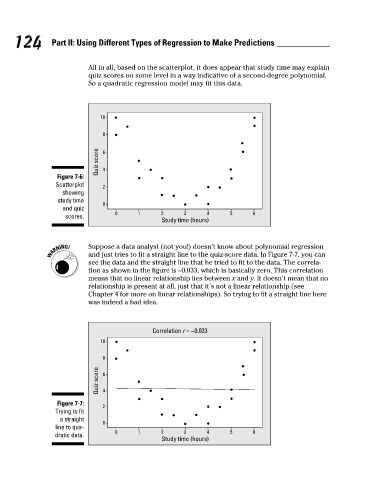
All in all, based on the scatterplot, it does appear that study time may explain
quiz scores on some level in a way indicative of a second-degree polynomial.
So a quadratic regression model may fit this data.
10
8
Quiz score 6 4
Figure 7-6:
Scatterplot 2
showing
study time
0
and quiz
0 1 2 3 4 5 6
scores. Study time (hours)
Suppose a data analyst (not you!) doesn’t know about polynomial regression
and just tries to fit a straight line to the quiz-score data. In Figure 7-7, you can
see the data and the straight line that he tried to fit to the data. The correla-
tion as shown in the figure is –0.033, which is basically zero. This correlation
means that no linear relationship lies between x and y. It doesn’t mean that no
relationship is present at all, just that it’s not a linear relationship (see
Chapter 4 for more on linear relationships). So trying to fit a straight line here
was indeed a bad idea.
Correlation r = −0.033
10
8
Quiz score 6 4
Figure 7-7:
2
Trying to fit
a straight
0
line to qua-
0 1 2 3 4 5 6
dratic data. Study time (hours)
12_466469-ch07.indd 124 7/24/09 9:39:08 AM