
Page 157 - Statistics II for Dummies
P. 157
Chapter 8: Making Predictions by Using Logistic Regression
The magnitude of β (indicated by its absolute value) tells you how much cur- 141
1
vature is in the model. High values indicate a steep curvature, and low values
indicate gradual curvature. The parameter β just shifts the S-curve to the
0
proper location to fit your data. It shows you the cutoff point where x-values
change from high to low probability and vice versa.
The logistic regression model in action
Often, the best way to figure something out is to see it in action. In this sec-
tion, I give you an example of a situation where you can use a logistic regres-
sion model to estimate a probability. (I expand on this example later in this
chapter; for now, I’m just setting up a scenario for logistic regression.)
Suppose movie marketers want to estimate the chance that someone will
enjoy a certain family movie, and you believe age may have something to do
with it. Translating this research question into x’s and y’s, the response vari-
able (y) is whether or not a person will enjoy the movie, and the explanatory
variable (x) is the person’s age. You want to estimate p, the chance of some-
one enjoying the movie.
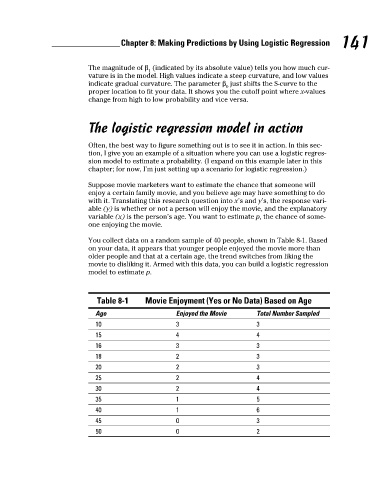
You collect data on a random sample of 40 people, shown in Table 8-1. Based
on your data, it appears that younger people enjoyed the movie more than
older people and that at a certain age, the trend switches from liking the
movie to disliking it. Armed with this data, you can build a logistic regression
model to estimate p.
Table 8-1 Movie Enjoyment (Yes or No Data) Based on Age
Age Enjoyed the Movie Total Number Sampled
10 3 3
15 4 4
16 3 3
18 2 3
20 2 3
25 2 4
30 2 4
35 1 5
40 1 6
45 0 3
50 0 2
7/23/09 9:28:36 PM
13_466469-ch08.indd 141 7/23/09 9:28:36 PM
13_466469-ch08.indd 141