
Page 159 - Statistics II for Dummies
P. 159
Chapter 8: Making Predictions by Using Logistic Regression
1. Input your data in the spreadsheet as a table that lists each value 143
of the x variable in column one, the number of yeses for that value
of x in column two, and the total number of trials at that x-value in
column three.
These last two columns represent the outcome of the response variable
y. (For an example of how to enter your data, see Table 8-1 based on the
movie and age data.)
2. Go to Stat>Regression>Binary Logistic Regression.
3. Beside the Success option, select your variable name from column
two, and beside Trial, select your variable name for column three.
4. Under Model, select your variable name from column one, because
that’s the column containing the explanatory (x) variable in your
model.
5. Click OK, and you get your logistic regression output.
When you fit a logistic regression model to your data, the computer output is
composed of two major portions:
✓ The model-building portion: In this part of the output, you can find the
coefficients b and b . (I describe coefficients in the next section.)
0 1
✓ The model-fitting portion: You can see the results of a Chi-square good-
ness-of-fit test (see Chapter 15) as well as the percentage of concordant
and discordant pairs in this section of the output. (A concordant pair
means the predicted outcome from the model matches the observed
outcome from the data. A discordant pair is one that doesn’t match.)
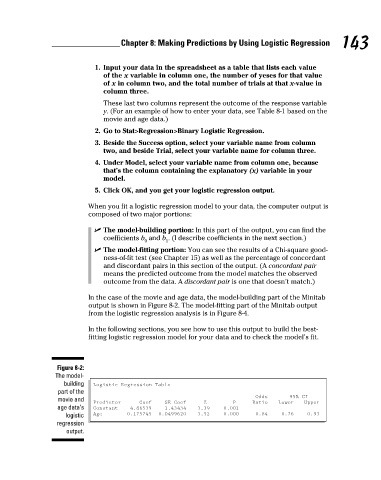
In the case of the movie and age data, the model-building part of the Minitab
output is shown in Figure 8-2. The model-fitting part of the Minitab output
from the logistic regression analysis is in Figure 8-4.
In the following sections, you see how to use this output to build the best-
fitting logistic regression model for your data and to check the model’s fit.
Figure 8-2:
The model-
building Logistic Regression Table
part of the
Odds 95% CI
movie and
Predictor Coef SE Coef Z P Ratio Lower Upper
age data’s Constant 4.86539 1.43434 3.39 0.001
logistic Age –0.175745 0.0499620 –3.52 0.000 0.84 0.76 0.93
regression
output.
7/23/09 9:28:36 PM
13_466469-ch08.indd 143
13_466469-ch08.indd 143 7/23/09 9:28:36 PM