
Page 163 - Statistics II for Dummies
P. 163
Chapter 8: Making Predictions by Using Logistic Regression
Fitting the movie model 147
You’re ready to check out the fit of the movie data to make sure you still
have a job when the box office totals come in.
Step one: p-value for Chi-squared
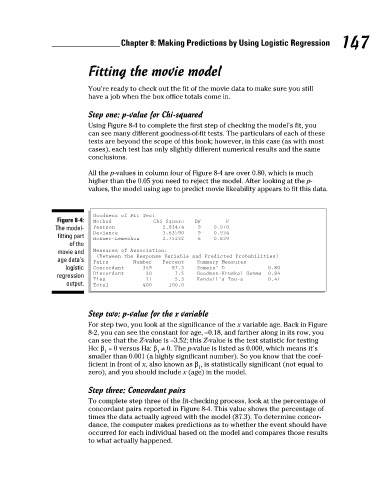
Using Figure 8-4 to complete the first step of checking the model’s fit, you
can see many different goodness-of-fit tests. The particulars of each of these
tests are beyond the scope of this book; however, in this case (as with most
cases), each test has only slightly different numerical results and the same
conclusions.
All the p-values in column four of Figure 8-4 are over 0.80, which is much
higher than the 0.05 you need to reject the model. After looking at the p-
values, the model using age to predict movie likeability appears to fit this data.
Goodness-of-Fit Test
Figure 8-4: Method Chi-Square DF P
The model- Pearson 2.83474 9 0.970
Deviance 3.63590 9 0.934
fitting part
Hosmer-Lemeshow 2.75232 6 0.839
of the
movie and Measures of Association:
(Between the Response Variable and Predicted Probabilities)
age data’s Pairs Number Percent Summary Measures
logistic Concordant 349 87.3 Somers’ D 0.80
regression Discordant 30 7.5 Goodman-Kruskal Gamma 0.84
Ties 21 5.3 Kendall’s Tau-a 0.41
output. Total 400 100.0
Step two: p-value for the x variable
For step two, you look at the significance of the x variable age. Back in Figure
8-2, you can see the constant for age, –0.18, and farther along in its row, you
can see that the Z-value is –3.52; this Z-value is the test statistic for testing
Ho: β = 0 versus Ha: β ≠ 0. The p-value is listed as 0.000, which means it’s
1 1
smaller than 0.001 (a highly significant number). So you know that the coef-
ficient in front of x, also known as β , is statistically significant (not equal to
1
zero), and you should include x (age) in the model.
Step three: Concordant pairs
To complete step three of the fit-checking process, look at the percentage of
concordant pairs reported in Figure 8-4. This value shows the percentage of
times the data actually agreed with the model (87.3). To determine concor-
dance, the computer makes predictions as to whether the event should have
occurred for each individual based on the model and compares those results
to what actually happened.
7/23/09 9:28:37 PM
13_466469-ch08.indd 147
13_466469-ch08.indd 147 7/23/09 9:28:37 PM