
Page 164 - Statistics II for Dummies
P. 164
148
Part II: Using Different Types of Regression to Make Predictions
The logistic regression model is for p, the probability of the event occurring,
so if p is estimated to be > 0.50 for some value of x, the computer predicts that
the event will occur (versus not occurring). If the estimated value of p is < 0.50
for a particular x-value, the computer predicts that it won’t occur.
For the movie and age data, the percentage of concordant pairs (that is, the
percentage of times the model made the right decision in predicting what
would happen) is 87.3 percent, which is quite high.
The percentage of concordant pairs was obtained by taking the number of
concordant pairs and dividing by the total number of pairs. I’d start getting
excited if the percentage of concordant pairs got over 75 percent; the higher,
the better.
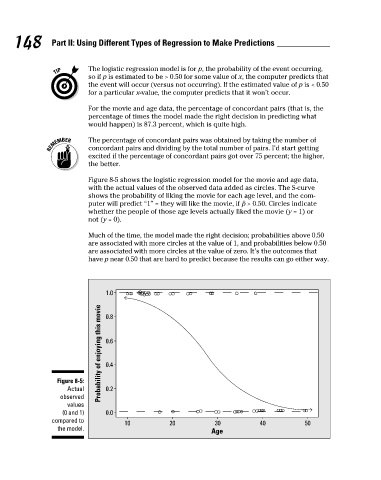
Figure 8-5 shows the logistic regression model for the movie and age data,
with the actual values of the observed data added as circles. The S-curve
shows the probability of liking the movie for each age level, and the com-
puter will predict “1” = they will like the movie, if > 0.50. Circles indicate
whether the people of those age levels actually liked the movie (y = 1) or
not (y = 0).
Much of the time, the model made the right decision; probabilities above 0.50
are associated with more circles at the value of 1, and probabilities below 0.50
are associated with more circles at the value of zero. It’s the outcomes that
have p near 0.50 that are hard to predict because the results can go either way.
1.0
Probability of enjoying this movie 0.6
0.8
0.4
Figure 8-5:
Actual 0.2
observed
values
(0 and 1) 0.0
compared to 10 20 30 40 50
the model. Age
7/23/09 9:28:37 PM
13_466469-ch08.indd 148 7/23/09 9:28:37 PM
13_466469-ch08.indd 148