
Page 161 - Statistics II for Dummies
P. 161
1.0 Chapter 8: Making Predictions by Using Logistic Regression 145
Probability of enjoying this movie 0.6
0.8
0.4
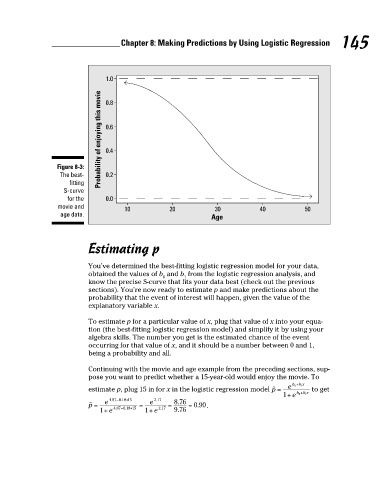
Figure 8-3:
The best- 0.2
fitting
S-curve
for the 0.0
movie and 10 20 30 40 50
age data. Age
Estimating p
You’ve determined the best-fitting logistic regression model for your data,
obtained the values of b and b from the logistic regression analysis, and
0 1
know the precise S-curve that fits your data best (check out the previous
sections). You’re now ready to estimate p and make predictions about the
probability that the event of interest will happen, given the value of the
explanatory variable x.
To estimate p for a particular value of x, plug that value of x into your equa-
tion (the best-fitting logistic regression model) and simplify it by using your
algebra skills. The number you get is the estimated chance of the event
occurring for that value of x, and it should be a number between 0 and 1,
being a probability and all.
Continuing with the movie and age example from the preceding sections, sup-
pose you want to predict whether a 15-year-old would enjoy the movie. To
estimate p, plug 15 in for x in the logistic regression model to get
.
7/23/09 9:28:37 PM
13_466469-ch08.indd 145
13_466469-ch08.indd 145 7/23/09 9:28:37 PM