
Page 248 - Statistics II for Dummies
P. 248
232 Part IV: Building Strong Connections with Chi-Square Tests
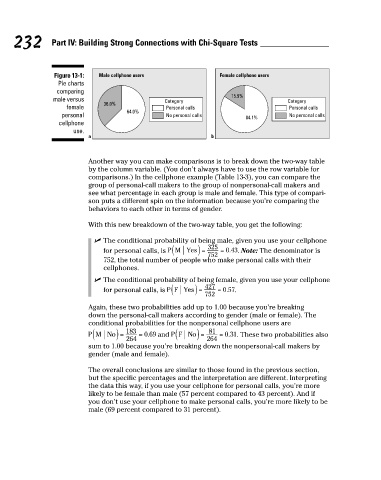
Figure 13-1: Male cellphone users Female cellphone users
Pie charts
comparing
male versus Category 15.9% Category
36.0%
female Personal calls Personal calls
64.0%
personal No personal calls 84.1% No personal calls
cellphone
use.
a b
Another way you can make comparisons is to break down the two-way table
by the column variable. (You don’t always have to use the row variable for
comparisons.) In the cellphone example (Table 13-3), you can compare the
group of personal-call makers to the group of nonpersonal-call makers and
see what percentage in each group is male and female. This type of compari-
son puts a different spin on the information because you’re comparing the
behaviors to each other in terms of gender.
With this new breakdown of the two-way table, you get the following:
✓ The conditional probability of being male, given you use your cellphone
for personal calls, is . Note: The denominator is
752, the total number of people who make personal calls with their
cellphones.
✓ The conditional probability of being female, given you use your cellphone
for personal calls, is .
Again, these two probabilities add up to 1.00 because you’re breaking
down the personal-call makers according to gender (male or female). The
conditional probabilities for the nonpersonal cellphone users are
and . These two probabilities also
sum to 1.00 because you’re breaking down the nonpersonal-call makers by
gender (male and female).
The overall conclusions are similar to those found in the previous section,
but the specific percentages and the interpretation are different. Interpreting
the data this way, if you use your cellphone for personal calls, you’re more
likely to be female than male (57 percent compared to 43 percent). And if
you don’t use your cellphone to make personal calls, you’re more likely to be
male (69 percent compared to 31 percent).
20_466469-ch13.indd 232 7/24/09 9:47:59 AM