
Page 34 - Statistics II for Dummies
P. 34
18 Part I: Tackling Data Analysis and Model-Building Basics
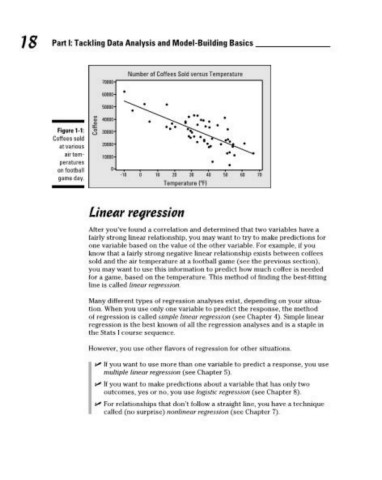
Number of Coffees Sold versus Temperature
70000
60000
50000
Coffees 40000
Figure 1-1: 30000
Coffees sold
at various 20000
air tem-
10000
peratures
on football 0
game day. -10 0 10 20 30 40 50 60 70
Temperature (ºF)
Linear regression
After you’ve found a correlation and determined that two variables have a
fairly strong linear relationship, you may want to try to make predictions for
one variable based on the value of the other variable. For example, if you
know that a fairly strong negative linear relationship exists between coffees
sold and the air temperature at a football game (see the previous section),
you may want to use this information to predict how much coffee is needed
for a game, based on the temperature. This method of finding the best-fitting
line is called linear regression.
Many different types of regression analyses exist, depending on your situa-
tion. When you use only one variable to predict the response, the method
of regression is called simple linear regression (see Chapter 4). Simple linear
regression is the best known of all the regression analyses and is a staple in
the Stats I course sequence.
However, you use other flavors of regression for other situations.
✓ If you want to use more than one variable to predict a response, you use
multiple linear regression (see Chapter 5).
✓ If you want to make predictions about a variable that has only two
outcomes, yes or no, you use logistic regression (see Chapter 8).
✓ For relationships that don’t follow a straight line, you have a technique
called (no surprise) nonlinear regression (see Chapter 7).
05_466469-ch01.indd 18 7/24/09 9:30:48 AM