
Page 35 - Statistics II for Dummies
P. 35
Chapter 1: Beyond Number Crunching: The Art and Science of Data Analysis 19
Chi-square tests
Correlation and regression techniques all assume that the variable being
studied in most detail (the response variable) is quantitative — that is, the
variable measures or counts something. You can also run into situations
where the data being studied isn’t quantitative, but rather categorical — that
is, the data represent categories, not measurements or counts. To study
relationships in categorical data, you use a Chi-square test for independence.
If the variables are found to be unrelated, they’re declared independent. If
they’re found to be related, they’re declared dependent.
Suppose you want to explore the relationship between gender and eating
breakfast. Because each of these variables is categorical, or qualitative, you
use a Chi-square test for independence. You survey 70 males and 70 females
and find that 25 men eat breakfast and 45 do not; for the females, 35 do eat
breakfast and 35 do not. Table 1-1 organizes this data and sets you up for the
Chi-square test for this scenario.
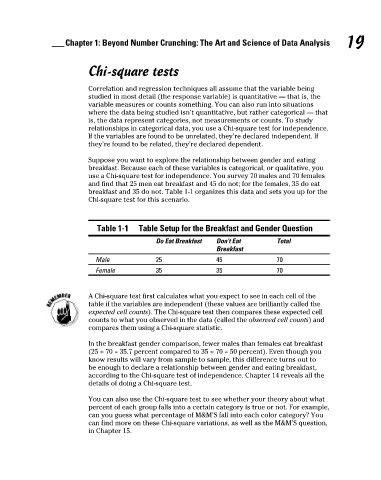
Table 1-1 Table Setup for the Breakfast and Gender Question
Do Eat Breakfast Don’t Eat Total
Breakfast
Male 25 45 70
Female 35 35 70
A Chi-square test first calculates what you expect to see in each cell of the
table if the variables are independent (these values are brilliantly called the
expected cell counts). The Chi-square test then compares these expected cell
counts to what you observed in the data (called the observed cell counts) and
compares them using a Chi-square statistic.
In the breakfast gender comparison, fewer males than females eat breakfast
(25 ÷ 70 = 35.7 percent compared to 35 ÷ 70 = 50 percent). Even though you
know results will vary from sample to sample, this difference turns out to
be enough to declare a relationship between gender and eating breakfast,
according to the Chi-square test of independence. Chapter 14 reveals all the
details of doing a Chi-square test.
You can also use the Chi-square test to see whether your theory about what
percent of each group falls into a certain category is true or not. For example,
can you guess what percentage of M&M’S fall into each color category? You
can find more on these Chi-square variations, as well as the M&M’S question,
in Chapter 15.
05_466469-ch01.indd 19 7/24/09 9:30:48 AM