Page 73 - Statistics II for Dummies
P. 73

Chapter 4: Getting in Line with Simple Linear Regression  57


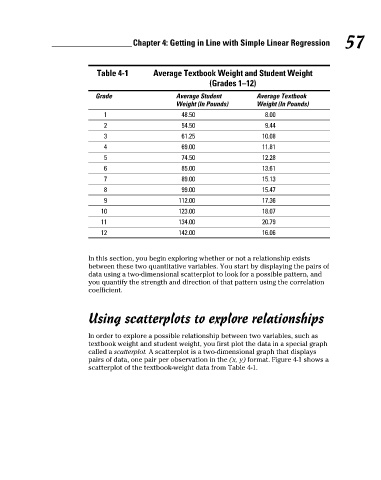
                                   Table 4-1      Average Textbook Weight and Student Weight
                                                                  (Grades 1–12)
                                  Grade                  Average Student       Average Textbook
                                                         Weight (In Pounds)    Weight (In Pounds)
                                     1                    48.50                  8.00
                                     2                    54.50                  9.44
                                     3                    61.25                  10.08
                                     4                    69.00                  11.81
                                     5                    74.50                  12.28
                                     6                    85.00                  13.61
                                     7                    89.00                  15.13
                                     8                    99.00                  15.47
                                     9                   112.00                  17.36
                                    10                   123.00                  18.07
                                    11                   134.00                  20.79
                                    12                   142.00                  16.06


                                In this section, you begin exploring whether or not a relationship exists
                                between these two quantitative variables. You start by displaying the pairs of
                                data using a two-dimensional scatterplot to look for a possible pattern, and
                                you quantify the strength and direction of that pattern using the correlation
                                coefficient.


                                Using scatterplots to explore relationships


                                In order to explore a possible relationship between two variables, such as
                                textbook weight and student weight, you first plot the data in a special graph
                                called a scatterplot. A scatterplot is a two-dimensional graph that displays
                                pairs of data, one pair per observation in the (x, y) format. Figure 4-1 shows a
                                scatterplot of the textbook-weight data from Table 4-1.


          09_466469-ch04.indd   57                                                                   7/24/09   10:20:35 AM
   68   69   70   71   72   73   74   75   76   77   78