
Page 119 - Statistics and Data Analysis in Geology
P. 119
Next Page
Analysis of Sequences of Data
emphasized that randomness itself cannot be proven, as the condition of random
occurrence is implied in the null hypothesis. Rather, at specified levels of signifi-
cance, we can demonstrate that the null hypothesis is incorrect and the sequence is
therefore not random. Or we can fail to reject the null hypothesis, implying that we
have failed to find any indication of nonrandomness. We will next consider proce-
dures for detecting trends, or systematic changes in average value, and will find that
runs tests may be used to good advantage in conjunction with these procedures.
Least-Squares Methods and Regression Analysis
In many types of problems, we are concerned not only with changes along a se-
quence, but are also interested in where these changes occur. To examine these
problems, we must have a collection of measurements of a variable and also must
know the locations of the measurement points. Both the variable and the scale
along the sequence must be expressed in units having magnitude: it is not suffi-
cient simply to know the order of succession of points. We are interested in the
general tendency of the data in most of the examples we will now consider. This
tendency will be used to interpolate between data points, extrapolate beyond the
data sequence, infer the presence of trends, or estimate characteristics that may be
of interest to the geologist. If certain assumptions can justifiably be made about
the distribution of the populations from which the samples are collected, statistical
tests called regression analyses can be performed.
It must be emphasized that we are now using the expression “sequence” in
the broadest possible sense. Regression methods are useful for much more than
the analysis of observations arranged in order in time or space; they can be used
to analyze any bivariate data set when it is useful to consider one of the variables
as a function of the other. It is as though one variable forms a scale along which
observations of the other variable are located, and we want to examine the nature
of changes in this variable as we move up or down the scale.
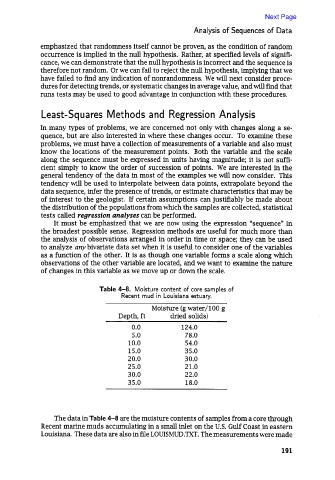
Table 4-8. Moisture content of core samples of
Recent mud in Louisiana estuary.
Moisture (g water/100 g
Depth, ft dried solids)
0.0 124.0
5.0 78.0
10.0 54.0
15.0 35.0
20.0 30.0
25.0 21.0
30.0 22.0
35.0 18.0
The data in Table 4-8 are the moisture contents of samples from a core through
Recent marine muds accumulating in a small inlet on the U.S. Gulf Coast in eastern
Louisiana. These data are also in file LOUISMUD.TXT. The measurements were made
191