
Page 118 - Statistics and Data Analysis in Geology
P. 118
Statistics and Data Analysis in Geology - Chapter 4
10
40
0 5 10 15 20 25 30
Number of radiolarians per cm2
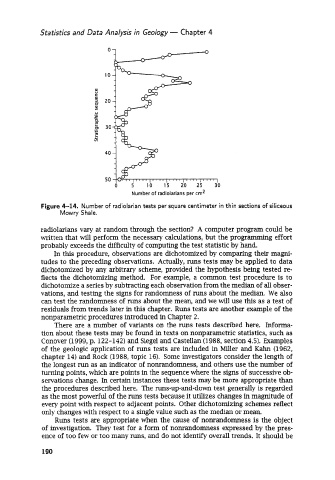
Figure 4-14. Number of radiolarian tests per square centimeter in thin sections of siliceous
Mowry Shale.
radiolarians vary at random through the section? A computer program could be
written that will perform the necessary calculations, but the programming effort
probably exceeds the difficulty of computing the test statistic by hand.
In this procedure, observations are dichotomized by comparing their magni-
tudes to the preceding observations. Actually, runs tests may be applied to data
dichotomized by any arbitrary scheme, provided the hypothesis being tested re-
flects the dichotomizing method. For example, a common test procedure is to
dichotomize a series by subtracting each observation from the median of all obser-
vations, and testing the signs for randomness of runs about the median. We also
can test the randomness of runs about the mean, and we will use this as a test of
residuals from trends later in this chapter. Runs tests are another example of the
nonparametric procedures introduced in Chapter 2.
There are a number of variants on the runs tests described here. Informa-
tion about these tests may be found in texts on nonparametric statistics, such as
Conover (1999, p. 122-142) and Siege1 and Castellan (1988, section 4.5). Examples
of the geologic application of runs tests are included in Miller and Kahn (1962,
chapter 14) and Rock (1988, topic 16). Some investigators consider the length of
the longest run as an indicator of nonrandomness, and others use the number of
turning points, which are points in the sequence where the signs of successive ob-
servations change. In certain instances these tests may be more appropriate than
the procedures described here. The runs-up-and-down test generally is regarded
as the most powerful of the runs tests because it utilizes changes in magnitude of
every point with respect to adjacent points. Other dichotomizing schemes reflect
only changes with respect to a single value such as the median or mean.
Runs tests are appropriate when the cause of nonrandomness is the object
of investigation. They test for a form of nonrandomness expressed by the pres-
ence of too few or too many runs, and do not identify overall trends. It should be
190