
Page 113 - Statistics and Data Analysis in Geology
P. 113
Analysis of Sequences of Data
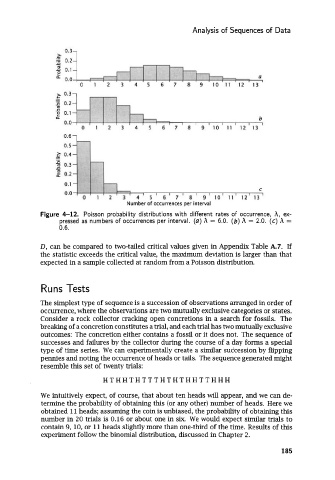
Figure 4-12. Poisson probability distributions with difFerent rates of occurrence, A, ex-
pressed as numbers of occurrences per interval. (a) h = 6.0. (b) h = 2.0. (c) h =
0.6.
D, can be compared to two-tailed critical values given in Appendix Table A.7. If
the statistic exceeds the critical value, the maximum deviation is larger than that
expected in a sample collected at random from a Poisson distribution.
Runs Tests
The simplest type of sequence is a succession of observations arranged in order of
occurrence, where the observations are two mutually exclusive categories or states.
Consider a rock collector cracking open concretions in a search for fossils. The
breaking of a concretion constitutes a trial, and each trial has two mutually exclusive
outcomes: The concretion either contains a fossil or it does not. The sequence of
successes and failures by the collector during the course of a day forms a special
type of time series. We can experimentally create a similar succession by flipping
pennies and noting the occurrence of heads or tails. The sequence generated might
resemble this set of twenty trials:
HTHHTHTTTHTHTHHTTHHH
We intuitively expect, of course, that about ten heads will appear, and we can de-
termine the probability of obtaining this (or any other) number of heads. Here we
obtained 11 heads; assuming the coin is unbiased, the probability of obtaining this
number in 20 trials is 0.16 or about one in six. We would expect similar trials to
contain 9, 10, or 11 heads slightly more than one-third of the time. Results of this
experiment follow the binomial distribution, discussed in Chapter 2.
185