
Page 111 - Statistics and Data Analysis in Geology
P. 111
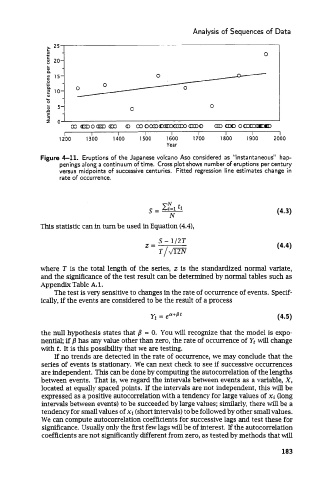
Analysis of Sequences of Data


               5  25
                                                                                0
               Y
               ; 20-
               L
               0)
               n
               2 15-                            0
               .-
               0
               o.
               Y
               2  10-
               01
               L
               k
               n  5-                    0                       0
               5
               2  0


             This statistic can in turn be used in Equation (4.4),
                                                 S  - 1/2T
                                             Z=                                     (4.4)
                                                 T/rn


             where  T  is the total length of  the series, z  is the  standardized normal variate,
             and the significance of  the test result can be determined by normal tables such as
             Appendix Table A. 1.
                 The test is very sensitive to changes in the rate of  occurrence of  events. Specif-
             ically, if  the events are considered to be the result of  a process

                                              yt = p+Bt                             (4.5)

             the null hypothesis states that fi  = 0. You will recognize that the model is expo-
             nential; if fi has any value other than zero, the rate of  occurrence of  Yt will change
             with t. It is this possibility that we are testing.
                 If  no trends are detected in the rate of  occurrence, we may conclude that the
             series of  events is stationary. We  can next check to see if successive occurrences
             are independent. This can be done by computing the autocorrelation of the lengths
             between events.  That is, we regard the intervals between events as a variable, X,
             located at equally spaced points. If  the intervals are not independent, this will be
              expressed as a positive autocorrelation with a tendency for large values of  Xi (long
             intervals between events) to be succeeded by large values; similarly, there will be a
              tendency for small values of xi (short intervals) to be followed by other smallvalues.
             We  can compute autocorrelation coefficients for successive lags and test these for
              significance. Usually only the first few lags will be of interest. If the autocorrelation
              coefficients are not significantly different from zero, as tested by methods that will

                                                                                      183