
Page 109 - Statistics and Data Analysis in Geology
P. 109
Analysis of Sequences of Data
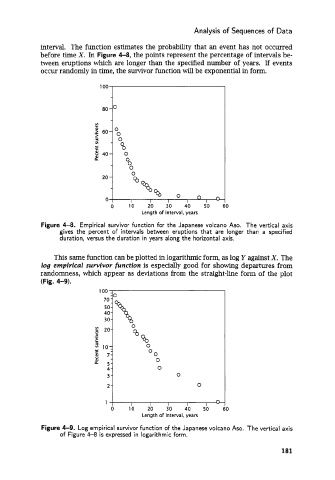
interval. The function estimates the probability that an event has not occurred
before time X. In Figure 4-8, the points represent the percentage of intervals be-
tween eruptions which are longer than the specified number of years. If events
occur randomly in time, the survivor function will be exponential in form.
D
Length of interval, years
Figure 4-8. Empirical survivor function for the Japanese volcano Aso. The vertical axis
gives the percent of intervals between eruptions that are longer than a specified
duration, versus the duration in years along the horizontal axis.
This same function can be plotted in logarithmic form, as log Y against X. The
log empirical survivor function is especially good for showing departures from
randomness, which appear as deviations from the straight-line form of the plot
(Fig. 4-9).
100 -
-0
70 -
\
% 30-
0
Y? 20- 0
8
'5 %
v, 101 0
s 7: OO
4-
8 5- 0
4- 0 0
3-
1 n
0
2-
30
40
50
10
0
20
D
Length of interval, years
Figure 4-9. Log empirical survivor function of the Japanese volcano Aso. The vertical axis
of Figure 4-8 is expressed in logarithmic form.
181